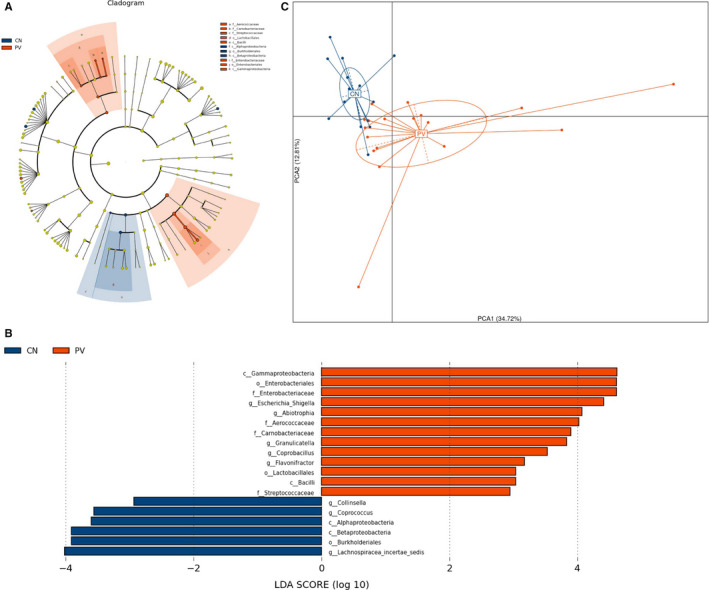
Figure 2.

Bacterial taxa difference between PV patients and healthy controls. Different taxa were detected by LefSe (P < 0.05, linear discriminant analysis [LDA] >2 logs). A, Different microbes showed in Cladogram of LefSe analysis. B, Nineteen different microbes with LDA >2 logs between patients (red bars) and controls (blue bars) are displayed. C, Principle component analyses (PcoA) plot of different microbial taxa between groups
