Figure 4.

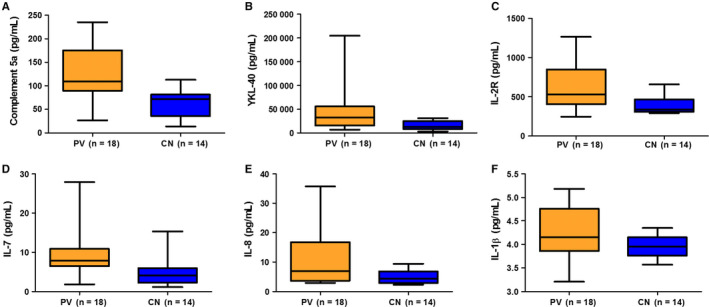
A‐F, Plasma concentrations of cytokines in patients and controls (P < 0.05 for all). The below and above lines indicate the minimum and maximum value. The middle lines represent the median values

A‐F, Plasma concentrations of cytokines in patients and controls (P < 0.05 for all). The below and above lines indicate the minimum and maximum value. The middle lines represent the median values