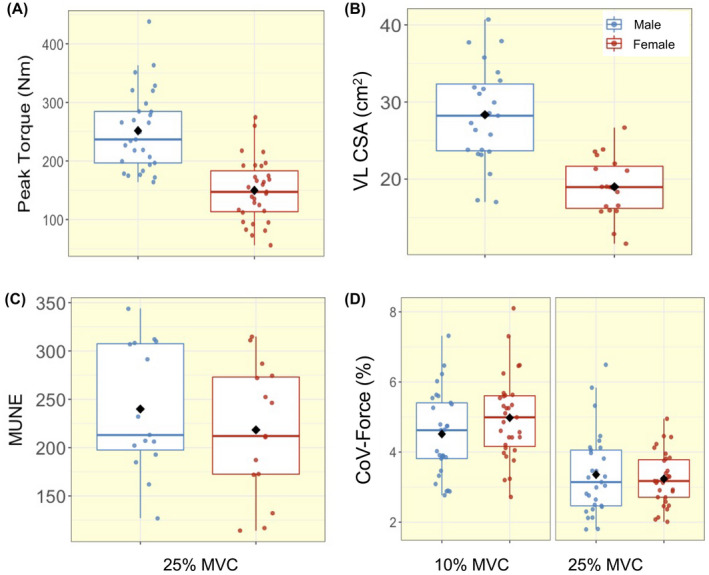
FIGURE 1.

Box‐and‐jitter plots of the individual participant means, and group means (black dot) of (A) peak torque, (B) vastus lateralis cross‐sectional area, (C) motor unit number estimates (MUNE), and (D) force steadiness at 10% and 25% maximum voluntary contraction (MVC), in males (blue) and females (red). CoV, coefficient of variation
