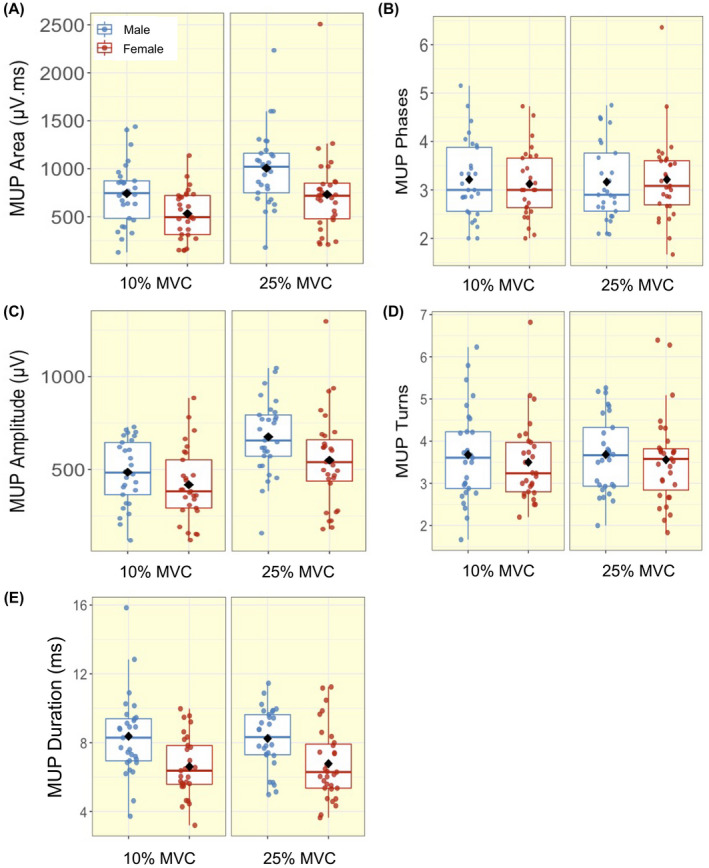
FIGURE 3.

Box‐and‐jitter plots of the individual participant means, and group means (black dot) of motor unit potential (MUP) (A) Area; (B) Phases; (C) Amplitude; (D) Turns; (E) Duration in males (blue) and females (red) at 10% and 25% maximum voluntary contraction (MVC)
