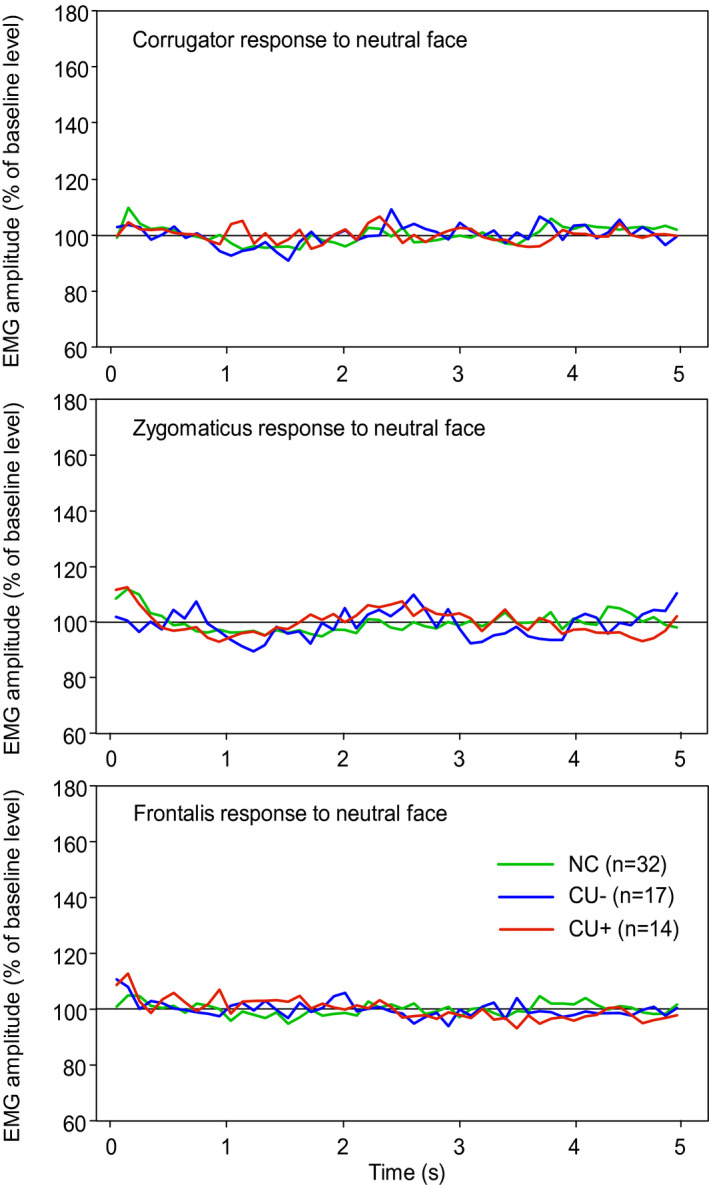
FIGURE 1.

Mean EMG responses during 5‐s videos of neutral facial expressions. NC, normal control group; CU−, participants with low callous‐unemotional traits; CU+, participants with high callous‐unemotional traits

Mean EMG responses during 5‐s videos of neutral facial expressions. NC, normal control group; CU−, participants with low callous‐unemotional traits; CU+, participants with high callous‐unemotional traits