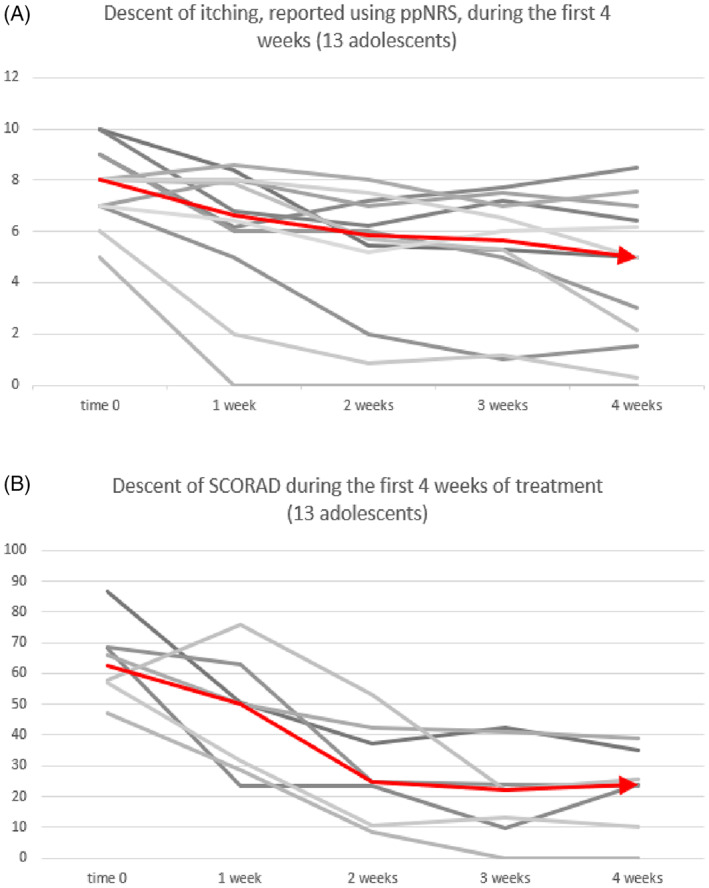
FIGURE 1.

(A) The graph shows the descent curves of pruritus calculated by ppNRS score during the 4 weeks of treatment with dupilumab, the value was weekly assessed. The median descent is depicted by the red line. (B) The graph shows the descent curves of SCORAD during the first 4 weeks of treatment with dupilumab, the value was weekly assessed. The median descent is depicted by the red line
