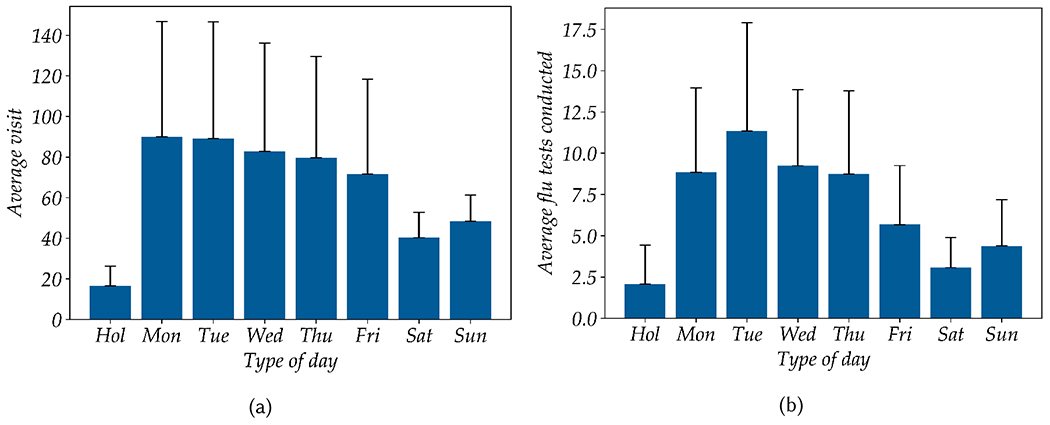
Fig. 9.

Distribution of total daily patient visits (a) and total flu test counts (b) over holidays (Hol), weekdays (Mon-Fri), and weekends (Sat-Sun). Each bar represent the mean value, with the thin black line represents one standard deviation.

Distribution of total daily patient visits (a) and total flu test counts (b) over holidays (Hol), weekdays (Mon-Fri), and weekends (Sat-Sun). Each bar represent the mean value, with the thin black line represents one standard deviation.