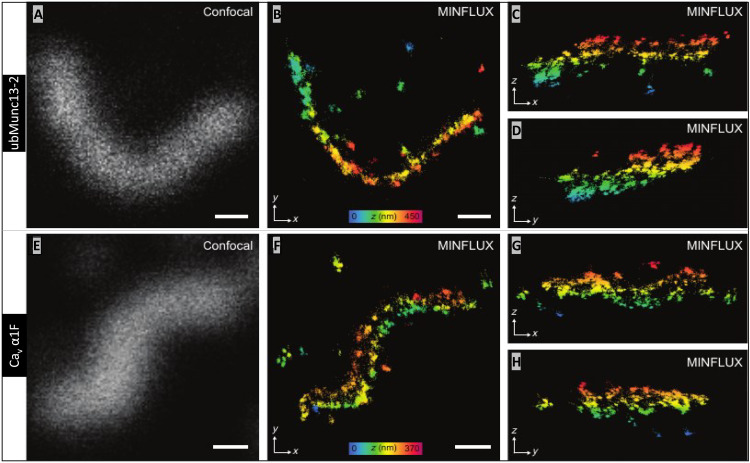
Fig. 6. Cav1.4 channels and ubMunc13-2 are bilaterally distributed about the rod ribbon AZ.
(A) Confocal image of ubMunc13-2 and, in (B), the corresponding 3D-MINFLUX image presented as a z-projection (movies S11 and S12: rotating ubMunc13-2–labeled rod ribbon). The same ribbon in (B) is presented as y- and x-projections in (C) and (D), respectively, partially revealing the two tracks of ubMunc13-2 in the central and end regions of the ribbon. (E to H) A ribbon labeled for Cav1.4 α1F subunits is presented in the same manner as ubMunc13-2 (movies S13 and S14: rotating α1F-labeled ribbon). Z direction, color scale bars in (B) and (F) range from 450 to 370 nm, respectively. White scale bars in (A), (B), (E), and (F) are 200 nm in length.

