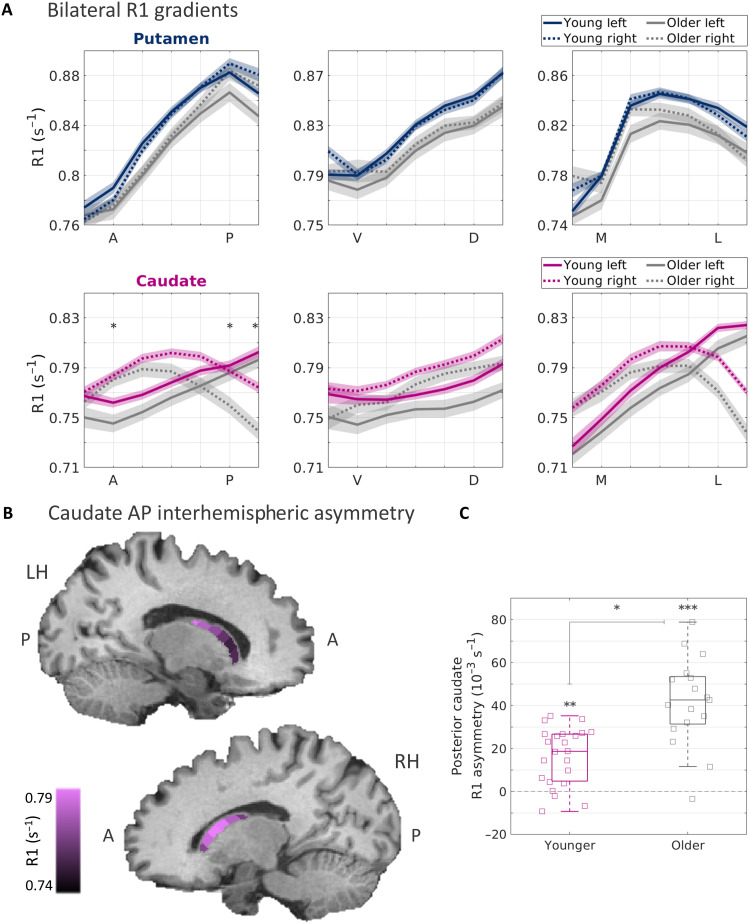
Fig. 2. Striatal R1 gradients reveal aging-related changes.
(A) R1 functions along the main axes of the left and right putamen (blue) and caudate (pink), averaged across 23 younger adults and 17 older adults (gray) from dataset A. Shaded areas represent ±1 SEM. The interhemispheric asymmetry along the AP axis is increased in the older group, as reflected by a three-way interaction effect of age group, hemisphere, and position (P < 0.001; see table S1). Asterisks represent segments along the AP axis where the interhemispheric difference was significantly higher in the older group, as shown in (C). (B) Visualization of the mean R1 gradients along the AP axis of the left and right caudate of the older group, overlaid on a T1-weighted image of a sample older adult. (C) Interhemispheric asymmetry is quantified for the posterior segments of the caudate AP axis (averaged across the two most posterior segments). Asymmetry is expressed as the within-subject, left-minus-right difference in R1 values. In each boxplot, the midline and edges represent the median and the 25th to 75th percentiles, respectively. *P < 10−4, **P < 10−5, and **P < 10−6. All P values are FDR-corrected.

