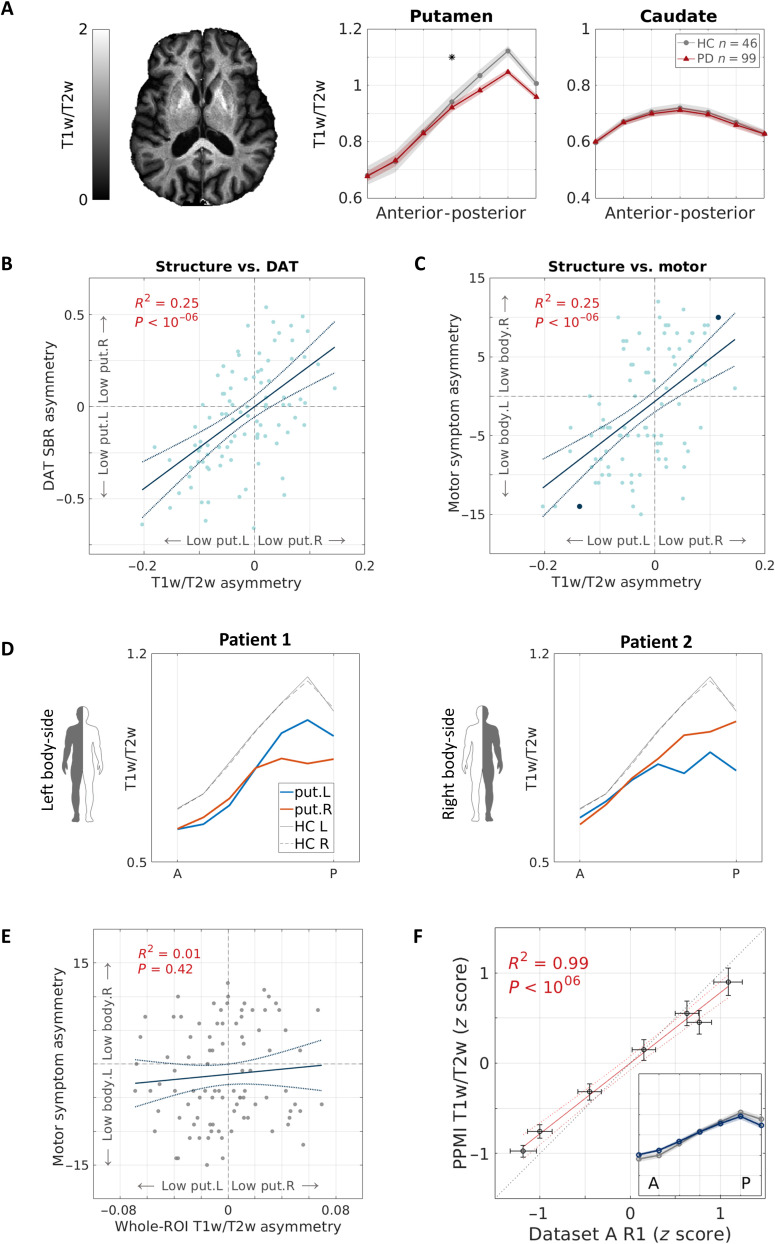
Fig. 4. Putamen gradients reveal microstructure decreases in PD, associated with dopaminergic and motor deficits.
(A) T1w/T2w spatial functions are shown for older PD patients (N = 99) and matched healthy controls (N = 46) in the AP axes of the putamen and caudate (averaged across hemispheres). The gradient significantly differs between groups, showing a decrease in posterior subregions in PD (linear mixed-effects model, PFDR < 0.05). The image shows a representative T1w/T2w axial slice of a PD patient, generated using the PPMI data. (B and C) Microstructural asymmetry in the posterior putamen of PD patients is positively correlated with (B) ipsilateral asymmetry in dopamine transporter binding ratio in the putamen, quantified by DaTSCAN SPECT, and (C) contralateral body-side motor signs. Solid and dashed lines represent the linear fit and 95% confidence interval, respectively. Highlighted in blue are two subjects shown in (D). (D) Individual putamen AP gradients of two PD patients who exhibit motor sign dominance in the left body side (patient 1) and the right body side (patient 2). Both patients show an asymmetric decrease in the posterior putamen that is associated contralaterally to the body side more affected by motor signs. (E) In contrast with our spatial approach, whole-putamen T1w/T2w L-R asymmetry did not show a meaningful correlation with motor asymmetry. R2 = 0.01, P = 0.42. (F) Semiquantitative T1w/T2w and quantitative R1 gradients along the AP axis of the putamen show high similarity. Data points represent the seven segments along the putamen’s AP axis. We plotted the z-scored, quantitative data of older healthy adults (dataset A, x axis) against the z-scored, semiquantitative data of healthy controls (PPMI data, y axis). Inset: z-scored T1w/T2w gradient (color) and z-scored R1 gradient (gray). Shaded area = ±1 SEM. put, putamen; HC, healthy controls; L, left; R, right.

