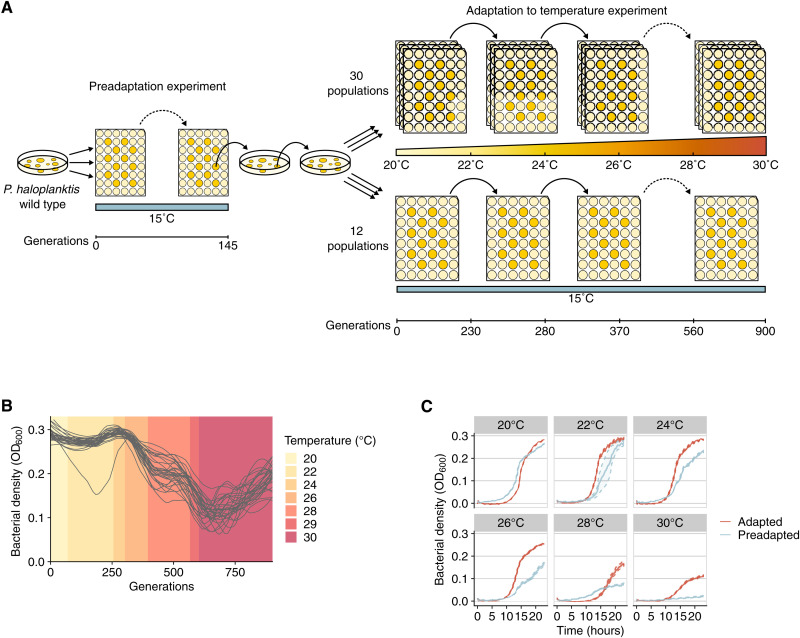
Fig. 1. Adaptation to gradual temperature increases.
(A) Experimental design. We evolved 30 replicate populations started from a single preadapted clone during 900 generations at gradually increasing temperatures. To determine the genetic basis of adaptation to rising temperatures, we sequenced the genomes of clones isolated throughout the experiment. (B) Bacterial density, quantified by the optical density of a bacterial culture at 600 nm (OD600) as a function of time, for each of 30 evolving populations. Each line corresponds to data from one population. Background color (see legend) indicates the temperature at which we measured bacterial density. (C) Fitness gains increase with temperature. Growth curves measured during 23 hours at different temperatures (see panel labels) using the initial preadapted clone (blue line) or populations adapted to each temperature (red line). The growth curve for the preadapted clone is the average of 12 biological replicates, and the growth curve for the evolved populations is the average of 90 biological replicates (three replicate population samples for each of 30 evolving populations). Shaded areas and dashed lines indicate 95% confidence intervals.

