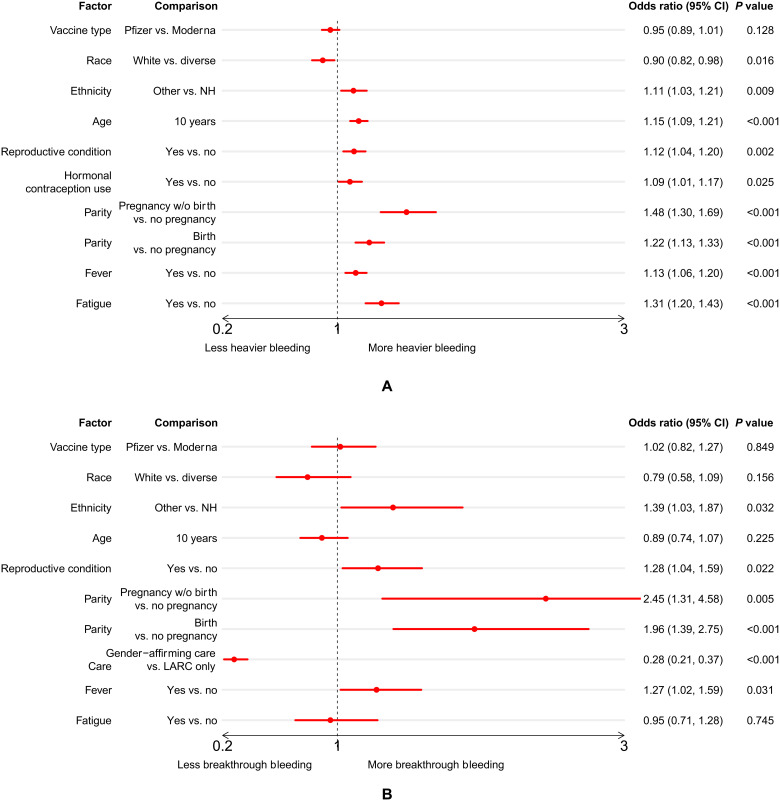
Fig. 3. Results of multivariate regressions.
Multivariate logistic regression of (A) heavier flow in the regularly menstruating group (N = 17,113, after removing those respondents with vaccines other than Pfizer or Moderna, or missing parity history or flow change) and (B) breakthrough bleeding in the nonmenstruating premenopausal group (N = 1771, after removing those respondents with vaccines other than Pfizer or Moderna, or missing parity history) after either dose of the vaccine. The graph presents the ratio of the odds of heavy bleeding occurring in the first group of the comparison versus the second group (except for age, which is in 10-year increments). If the odds ratio is greater than 1, the first group in the comparison has higher risk of experiencing heavier bleeding (or breakthrough bleeding). NH, not Hispanic/Latinx; CI, confidence interval.

