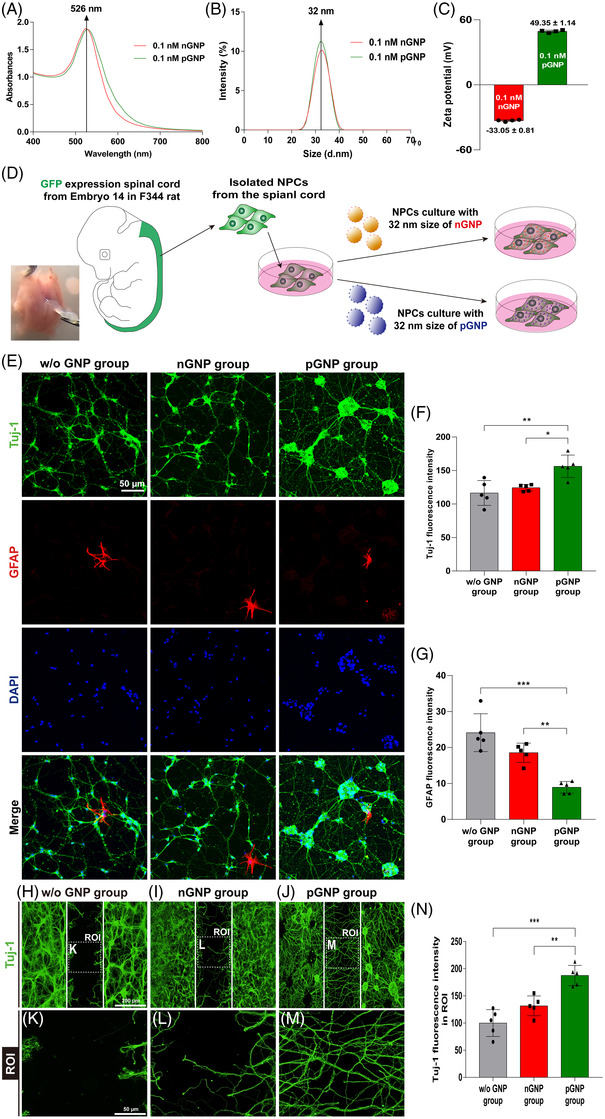
FIGURE 1.

(A) Absorbance levels ranging from 400 to 800 nm of negatively charged gold nanoparticles (nGNPs) and positively charged gold nanoparticles (pGNPs). (B) Size distributions of the nGNPs and pGNPs analysed by dynamic light scattering (DLS). (C) Surface charges of the nGNPs and pGNPs. Cell culture processes of isolated embryonic neural progenitor cells (NPCs) expressing green fluorescent protein (GFP). (D) Schematic procedure for the preparation of the nGNP/pGNP groups. NPCs were cultured for 7 days without GNP (w/o GNP), with nGNPs, or with pGNPs. (E) On day 7, the NPCs were co‐stained with glial fibrillary acidic protein (GFAP; expressed in red), neuron‐specific beta‐III tubulin (also called Tuj‐1; expressed in green) and DAPI (expressed in blue). The fluorescence intensities of (F) Tuj‐1 and (G) GFAP were divided according to the DAPI intensities for quantification. The neuronal growth of NPCs towards the block region. (H–J) Neuronal growth in the w/o GNP group, nGNP group and pGNP group after 2 days of cell culturing. (K–M) High‐magnification images of the region of interest (ROI) from (H–J). (N) Quantitative analysis of the Tuj‐1 intensity from (K–M). Results are expressed as the mean ± SEM (n = 5/group, * p < .05, ** p < .01 and *** p < .001)
