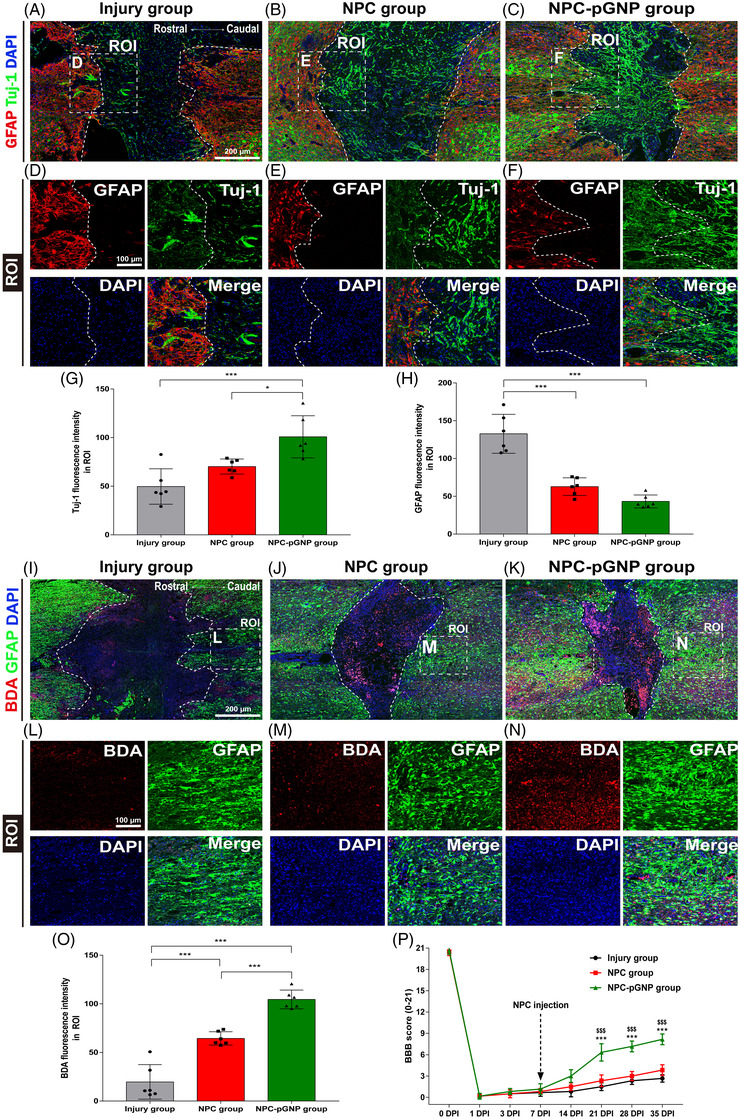
FIGURE 3.

Immunofluorescence (IF) staining and measurements of Basso, Bettie and Bresnahan (BBB) locomotor scores for the evaluation of recovery in spinal cord injury (SCI) rats. Representative images in the (A and I) injury group, (B and J) neural progenitor cell (NPC) group and (C and K) NPC‐positively charged gold nanoparticles (pGNP) group of SCI rats. (D–F) High‐magnification images of the region of interest (ROI) from (A–C). (L–N) High‐magnification images of ROI images beyond the epicentre lesion from (I–K). (G) Quantitative analysis of the Tuj‐1 intensity in the ROI. (H) Quantitative analysis of the glial fibrillary acidic protein (GFAP) intensity in the ROI. (O) Quantitative analysis of the biotinylated dextran amine (BDA) intensity in the ROI. Results are expressed as the mean ± SEM (n = 6/group, * p < .05 and *** p < .001). (P) Locomotor scores were evaluated in the injury, NPC and NPC‐pGNP groups for 35 days after SCI. Differences between the groups of NPC and NPC‐pGNP, shown as mean ± SD: *** p < .001. Differences between the group of Injury and NPC‐pGNP, shown as mean ± SD: $$$ p < .001
