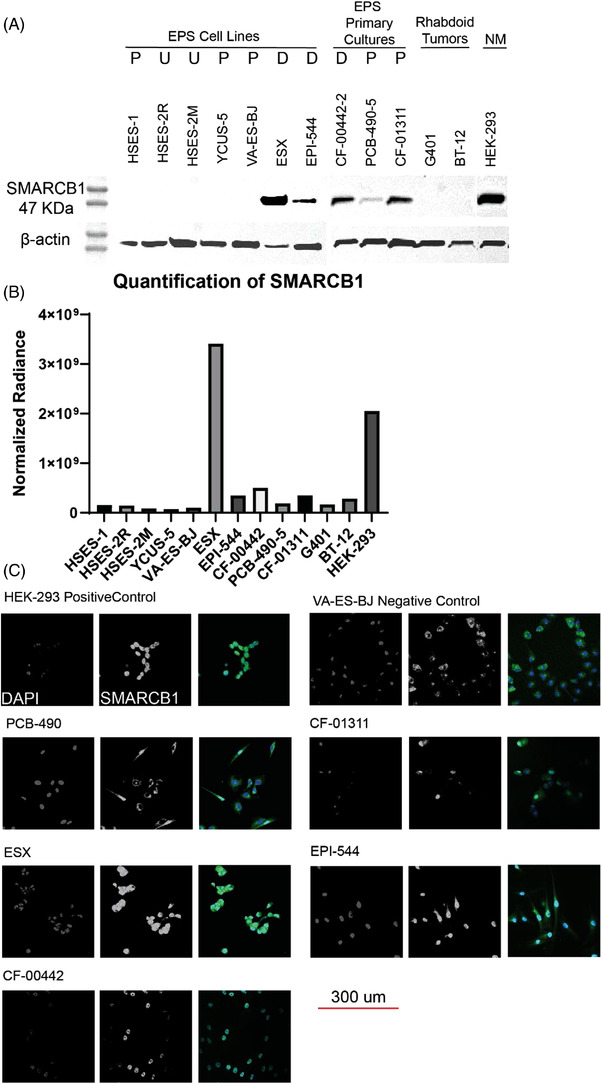
FIGURE 2.

Protein analysis and immunocytochemistry of SMARCB1 in EPS cultures. (A) Immunoblot of SMARCB1. (B) The quantification of the previous panel with all samples normalised to HSES‐2M β‐actin. (C) SMARCB1 is labelled with Alexa fluor 488 (green), and the nucleus is stained with DAPI (blue). The scale bar is 300 μm and scale is the same for all of the cell lines. Nuclear staining of SMARCB1 is demonstrated in HEK‐293, ESX, CF‐00442 and EPI‐544, while absent or mostly absent in PCB‐490, VA‐ES‐BJ and CF‐01311. Alexa fluor 488‐positive staining of cellular cytoplasm is likely a result of non‐specific antibody binding given that SMARCB1 is considered to be a nuclear protein. P = proximal, D = distal, U = unknown, NM = normal. Proximal versus distal location is given as anatomical, not histological
