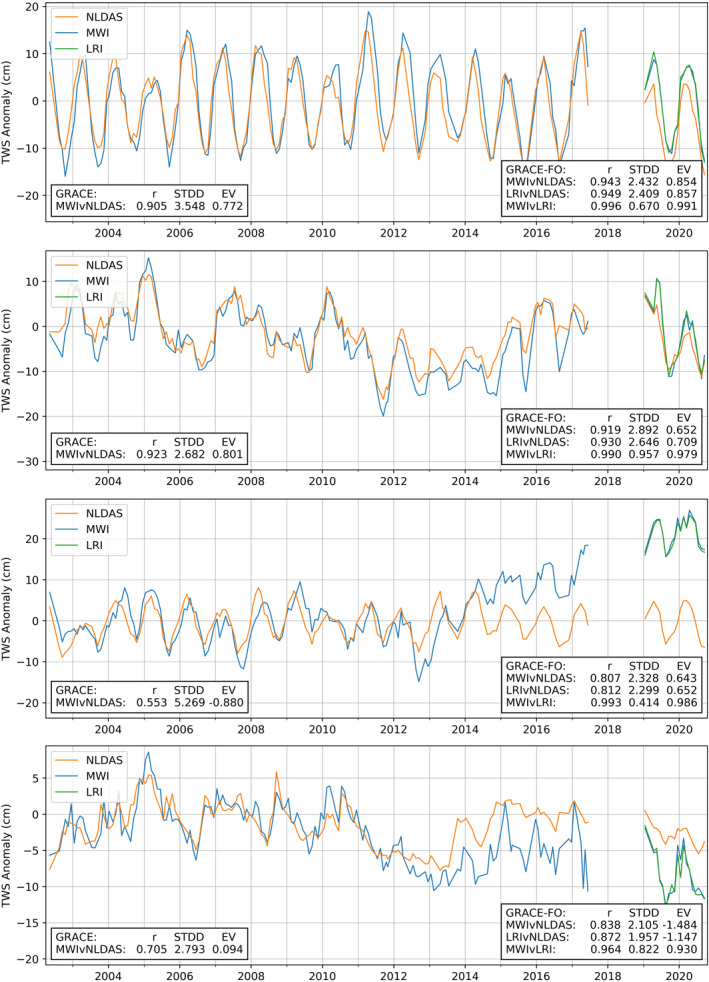
Figure 5.

Total water storage anomalies computed as flux accumulation from NLDAS (orange), and directly from the Gravity Recovery and Climate Experiment/ Gravity Recovery and Climate Experiment‐Follow On (GRACE‐FO) K/Ka‐band ranging (blue) and laser ranging interferometer GRACE‐FO (green) monthly solutions over several USGS hydrologic units (HU2). A 2004–2009 mean is removed from all time series. From top to bottom: Pacific Northwest region, Texas‐Gulf region, Great Lakes region, and Rio Grande region.
