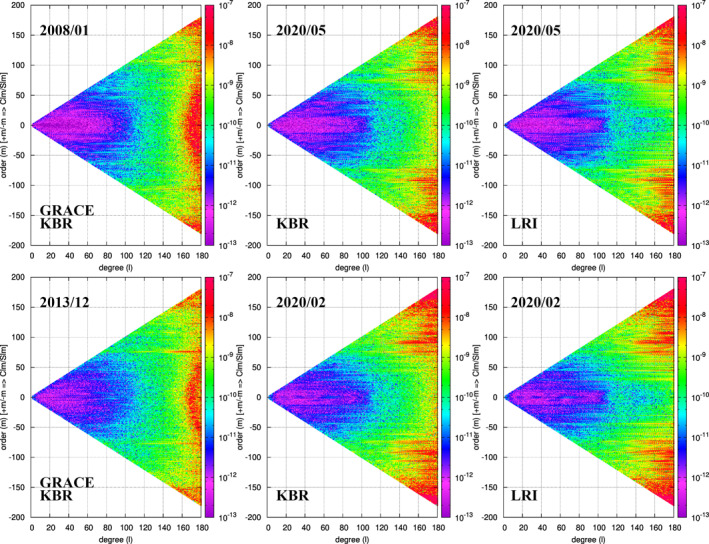
Figure 12.

Triangular plots showing the absolute values of the estimated gravity coefficients with respect to the coefficients derived from the monthly CSR mascons (up to degree and order 180). Left panels: K/Ka‐band ranging (KBR) solutions from Gravity Recovery and Climate Experiment. Center panels: KBR solutions from GRACE Follow‐On Mission. Right panels: laser ranging interferometer solutions. The top panels show relatively good months, while the bottom panels show months with degradation in the quality of the solutions.
