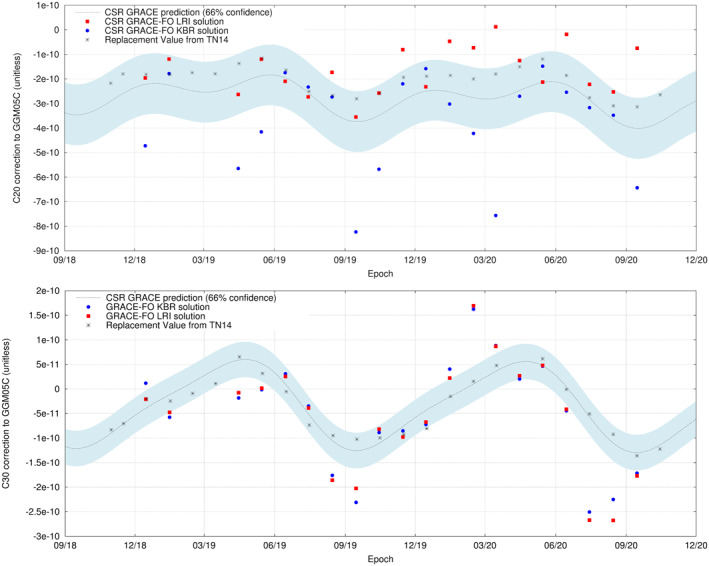
Figure 13.

C20 (top) and C30 (bottom) estimates from CSR monthly RL06 K/Ka‐band ranging and laser ranging interferometer (LRI) degree‐60 gravity solutions with respect to GGM05C (only the months where an LRI solution is available are plotted). The blue‐ribbon curve shows the predicted values based on a fit of the Gravity Recovery and Climate Experiment solutions which include a constant term, a trend, and an annual signal with a 66% confidence interval. For comparison, the replacement values recommended in NASA Goddard's TN14 are also provided.
