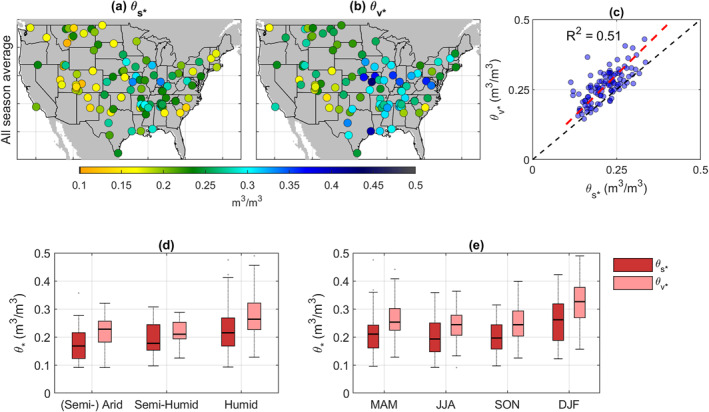
Figure 3.

Spatial distribution of θ s ‐ and θ v ‐based θ ∗ estimates, denoted as and , respectively (parts a and b). The spatial consistency of and is shown in c, with each symbol denoting θ ∗ estimates from a particular site. Red dashed line in part c denotes the relationship of and based on total least squares linear regression (slope is 1.18 and the intercept is 0.0076 m3/m3). The impacts of local climate and seasonality on θ ∗ are shown in parts d and e, respectively. Note that both and are estimated separately for each season and all‐season‐averages are presented in parts (a–d). The (Semi‐) Arid, Semi‐Humid, and Humid climate zones are classified as land areas with aridity index (calculated as the ratio of annual mean precipitation and potential evapotranspiration) lower than 0.5, 0.5–0.65, and higher than 0.65, respectively.
