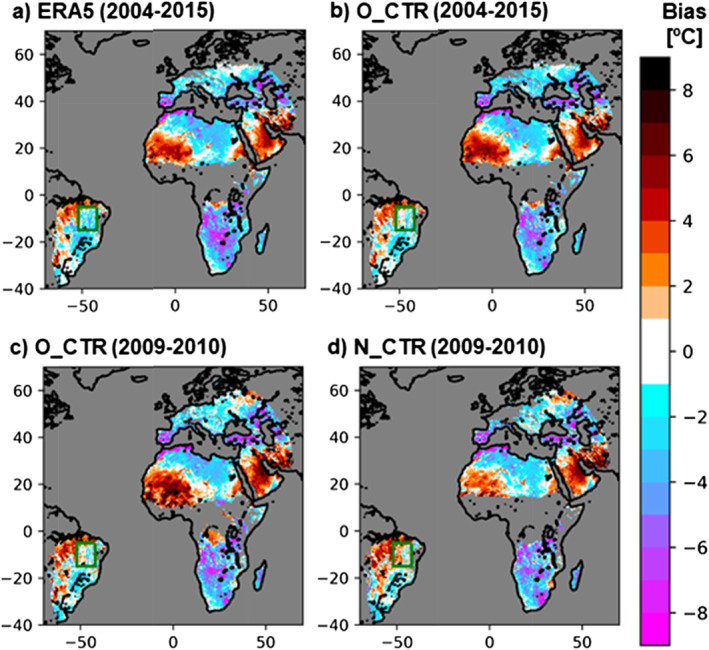
Figure 2.

Mean JJA daily maximum LST biases under clear‐sky conditions in (a) ERA5, (b) O_CTR for 2004–2015, (c) O_CTR for 2009–2010, and (d) N_CTR for 2009–2010 period. The Land Surface Analysis Satellite Application Facility LST is used as reference. The green box identifies the eBrz domain (see Section 5).
