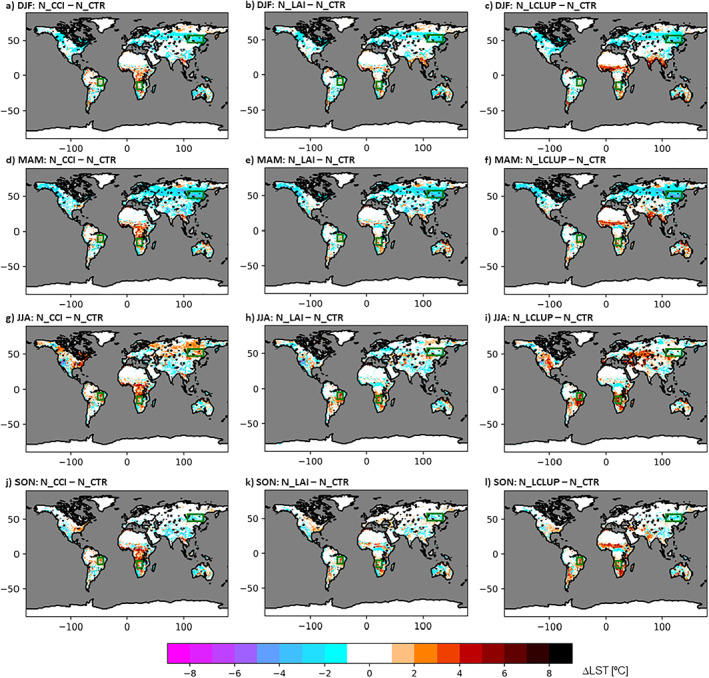
Figure 6.

Differences in seasonal averaged daily maximum LST between the experiments with updated vegetation and the control using the coupled simulations. From top to bottom, the different panels represent different seasons (respectively DJF, MAM, JJA, and SON). From left to right the different panels represent differences between different experiments (respectively N_CCI–N_CTR, N_LAI–N_CTR, and N_LCLUP–N_CTR). The green boxes identify the eBrz and eRus sub‐domains (see Section 5).
