
Figure 8.
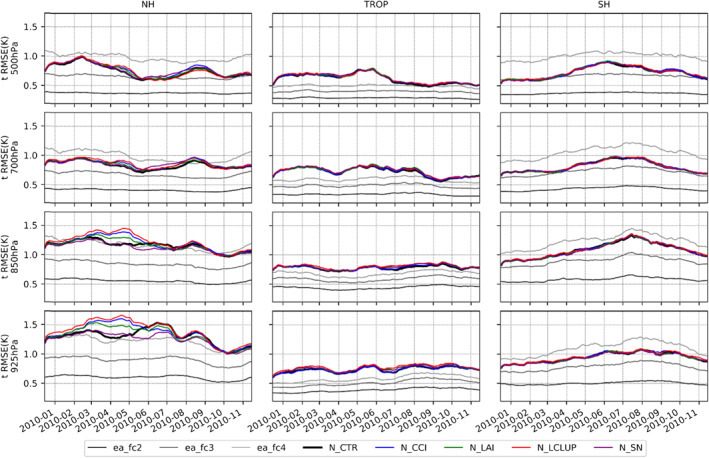
Mean root mean square difference in respect to ERA5 of temperature at different pressure levels (from top to bottom: 500, 700, 850, and 925 hPa), and different regions (from left to right: extratropical Northern Hemisphere region [NH], Tropical region [TROP], and extratropical Southern Hemisphere [SH]). The daily RMSE curves are smoothed with a 30‐day running window. The gray curves correspond to ERA5 day 2, 3, and 4 forecasts (ea_fc2, ea_fc3, and ea_fc4) and the experiments N_CTR (black), N_CCI (blue), N_LAI (green), N_LCLUP (red), and N_SN (purple).