
FIGURE 5.
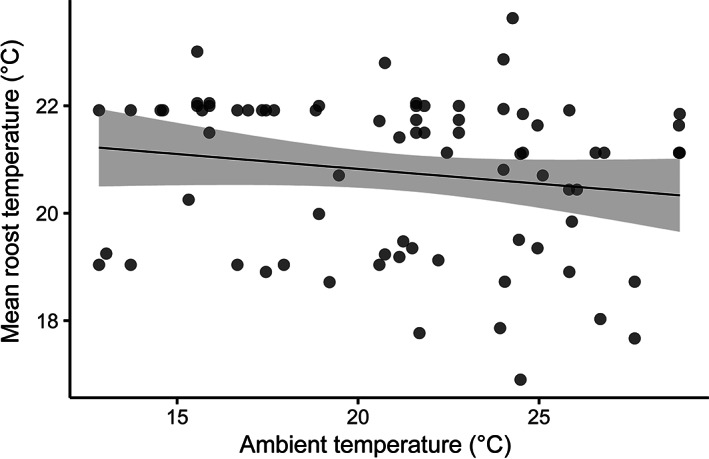
Scatter plot of the relationship between ambient temperature on a given day and mean temperature within used microhabitats. Each point is based on observed data, and represents a microhabitat used for 1 day; some microhabitats (n = 14) were used on multiple days and are therefore represented by multiple points on this plot. The line represents the regression line for this relationship and the gray band represents 95% confidence intervals. Ambient temperature on a given day did not influence whether bats used warm or cool microhabitats (p = 0.155; R 2 = 0.03). This figure corresponds to the bottom row in Figure 2, and is most closely matched by Figure 2i