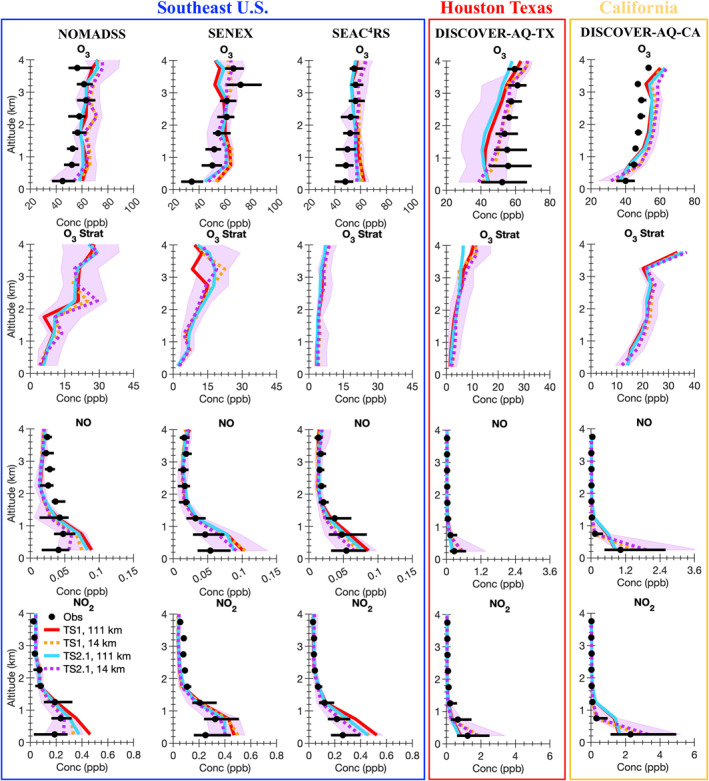
Figure 4.

Median vertical profile plots of the five aircraft campaigns for observations (black markers) and the model simulations (colored lines). The black horizontal lines and the purple shading show the 25th and 75th percentiles for the observations and the TS2.1, 14 km model simulation, respectively. Abbreviations are ozone (O3), stratospheric ozone tracer (O3 Strat), nitrogen oxide (NO), and nitrogen dioxide (NO2).
