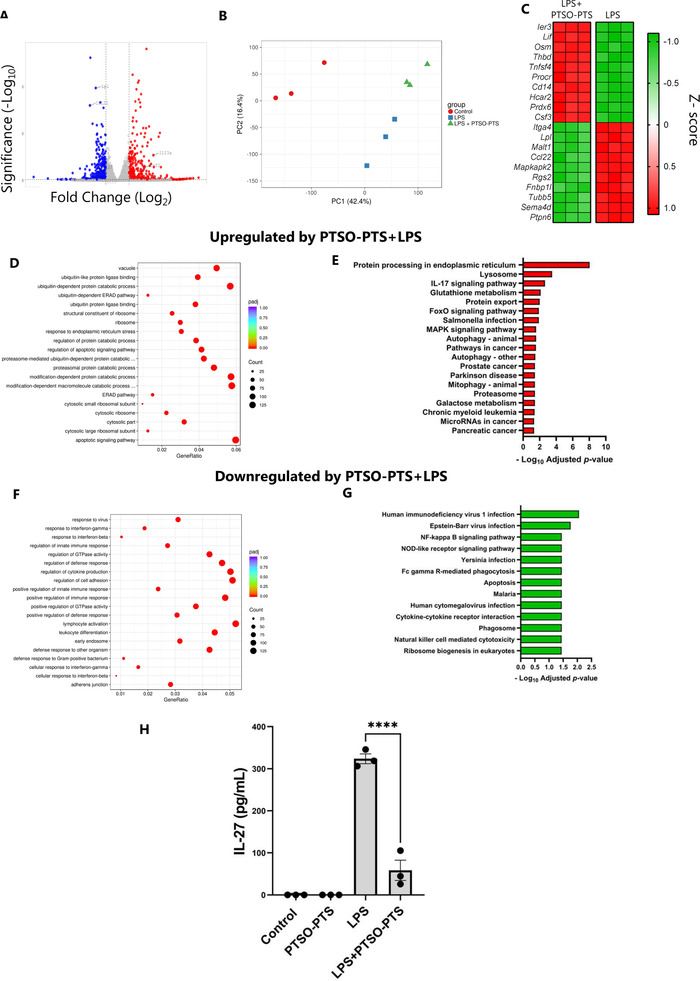
Figure 3.

PTSO‐PTS regulates transcriptional pathways and inflammatory responses following lipopolysaccharide treatment in RAW264.7 cells. A) Volcano plot of genes expressed showing fold changes in PTSO‐PTS and lipopolysaccharide (LPS) treated cells compared to LPS‐only treated controls. B) Principal component analysis showing clustering of cells without stimulation, LPS stimulation, or LPS combined with 20 µ;M PTSO‐PTS. C) Heat map of top 10 up‐ and down‐regulated genes in PTSO‐PTS +LPS treated RAW264.7 cells compared to only LPS treated cells. D) Gene ontology (GO) analysis of top upregulated pathways in LPS‐treated cells exposed to PTSO‐PTS compared to LPS‐only treated controls. E) Top upregulated KEGG pathways in LPS‐treated cells following exposure to PTSO‐PTS, compared to LPS‐only treated controls (p adj < 0.05). F) GO analysis of top downregulated pathways in LPS‐treated cells exposed to PTSO‐PTS compared to LPS‐only treated controls. G) Significantly upregulated KEGG pathways in LPS‐treated cells following exposure to PTSO‐PTS, compared to LPS‐only treated controls (p adj < 0.05). H) IL‐27 secretion from LPS‐stimulated RAW264.7 macrophages cultured with PTSO‐PTS. Data bars represent mean ± SEM. ****p ≤ 0.0001. n = 3 per treatment group.
