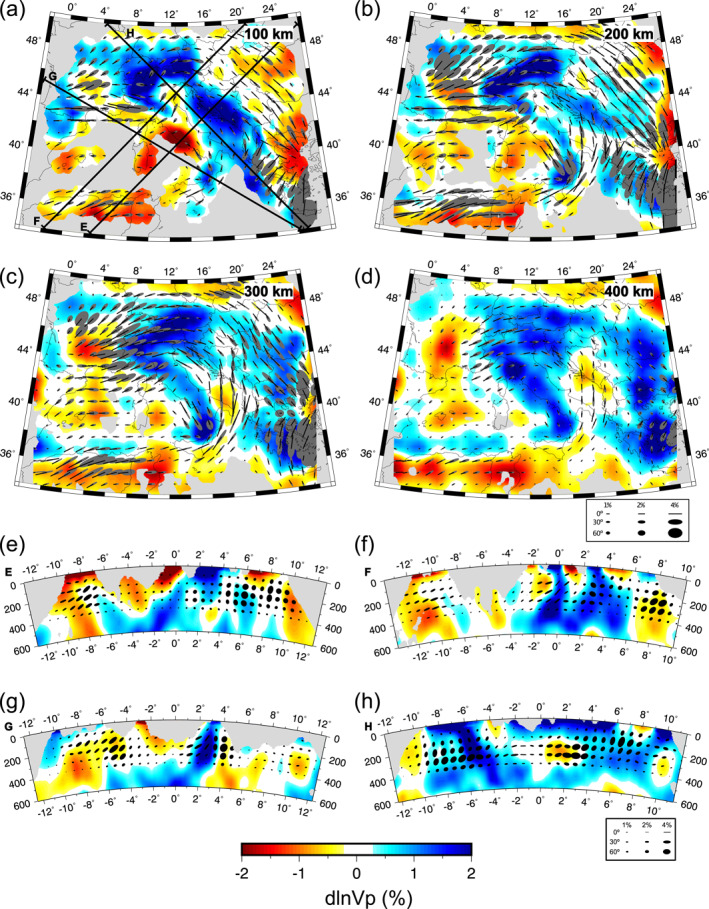
Figure 5.

The ani‐NEWTON21 model. Horizontal cross‐sections are shown at (a) 100 km, (b) 200 km, (c) 300 km, and (d) 400 km depth. Vertical cross‐sections are shown in (e–f) along the corresponding profile lines drawn in (a). Isotropic anomalies are plotted with respect to starting model. Anisotropy is plotted using ellipses as described in Figure 2. Areas of poor data coverage are masked in gray.
