
FIGURE 2.
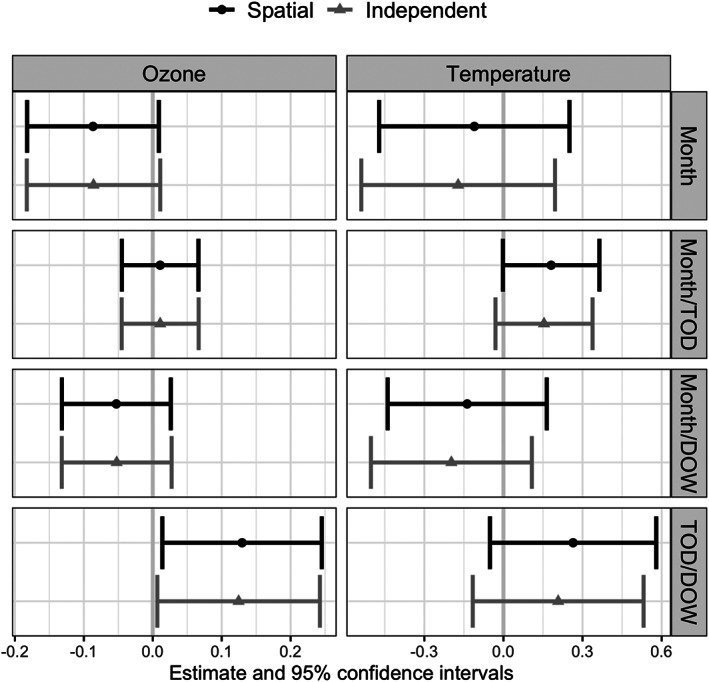
Estimates and 95% confidence intervals for the ozone and temperature exposure variables from both spatial and non‐spatial models. The labels on the right‐hand y‐axis correspond the four strata levels investigated. The panels in the left column are for the regression parameter associated with ozone, and the right is apparent temperature. With the exception of the time of day/weekday indicator strata for ozone, all the estimates are statistically insignificant at the 0.05 level