
FIGURE 3.
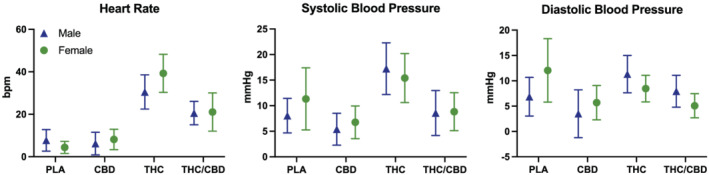
Cardiovascular effects by condition in male and female participants. Data points represent mean peak change from baseline, and error bars show 95% confidence intervals. PLA = placebo; CBD = CBD‐dominant (study 2 only); THC = THC‐dominant; THC/CBD = THC/CBD‐equivalent