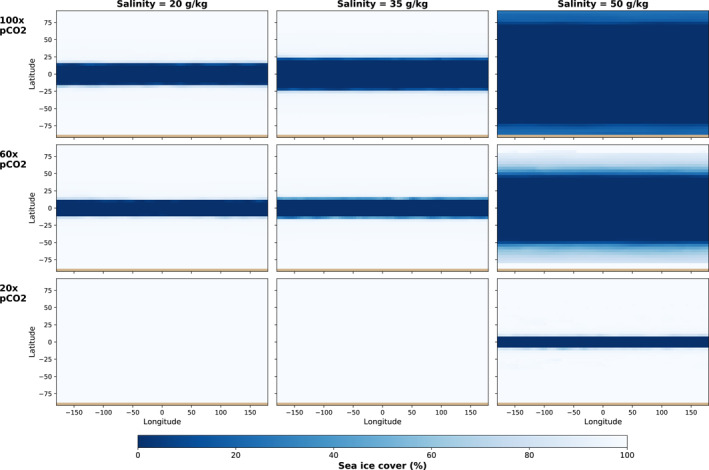
Figure 3.

Sea ice concentration for variable salinity and atmospheric CO2. The columns correspond to salinities of 20 (left), 35 (middle), and 50 g/kg (right); the rows correspond to CO2 levels of 100 (top), 60 (middle), and 20 xPIL (bottom). Dark blue corresponds to open water (0% ice cover) while white corresponds to 100% ice cover. Our parameter space yields climate states ranging from snowball glaciation to nearly ice‐free conditions. Severely glaciated Water Belt climates that are characterized by a band of equatorial open water are particularly common.
