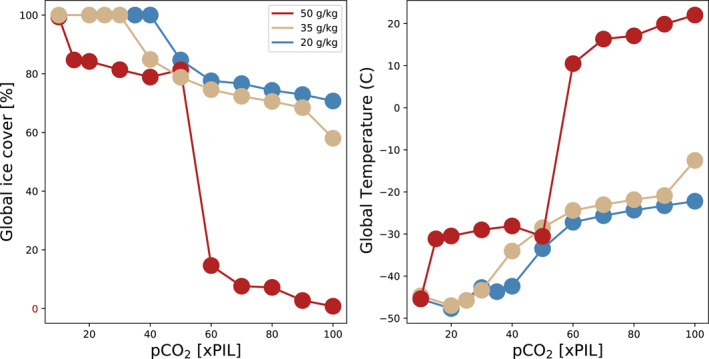
Figure 4.

Archean sea ice cover versus pCO2. The colored lines in each panel correspond to salinities of 20 (blue), 35 (green), and 50 g/kg (yellow). Four distinct climate states that are separated by abrupt transitions emerge for the CO2 range considered. The CO2 threshold for the transition between these states is sensitive to ocean salinity, allowing small changes in salinity to profoundly change climate. For example, at 100 xPIL CO2, global average surface temperature differs by 45°C between the 20 and 50 g/kg salinity scenarios. All simulations were initiated from an ice‐free state.
