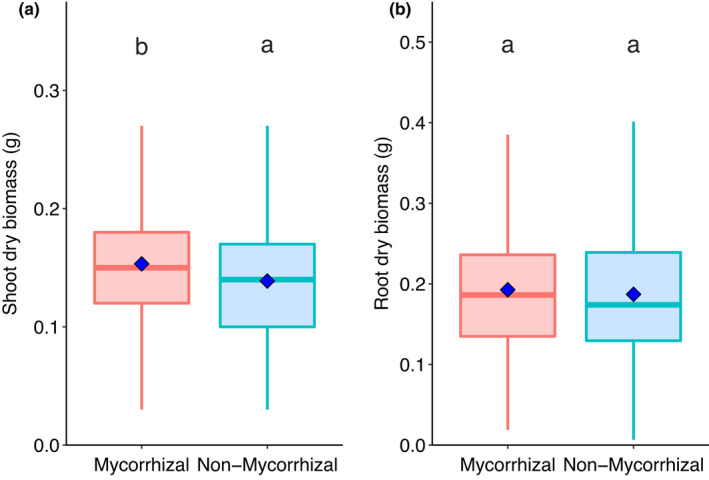
FIGURE 1.

Comparison of (a) shoot dry biomass and (b) root dry biomass in mycorrhiza‐inoculated and non‐mycorrhizal wheat (Triticum aestivum L.) plants. Boxes sharing letters are not significantly different, as determined by Wilcoxon signed‐rank test. Blue diamonds represent mean values for boxplot data. All replicate plants of 99 lines of Avalon × Cadenza DH mapping population are represented, n = 445
