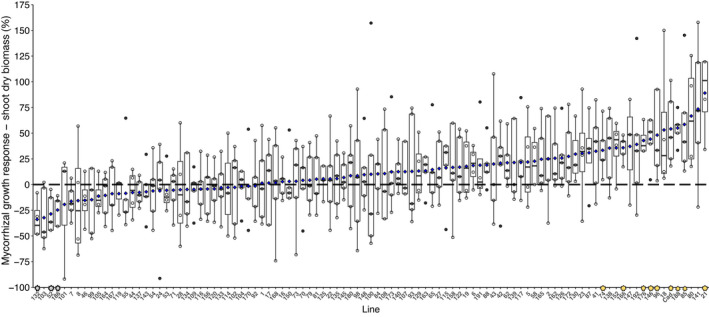
FIGURE 2.

Response of wheat (Triticum aestivum L.) shoot dry biomass to arbuscular mycorrhizal inoculation. Boxes represent individual wheat lines from the Avalon × Cadenza DH mapping population. Boxes are ranked by mean response to inoculation. Blue diamonds on boxes represent mean MGR value for that line. Grey stars on the x‐axis denote lines where Wilcoxon signal rank test shows the mean MGR is significantly lower than zero; yellow stars show lines where the mean value is significantly higher than zero. Except where noted in Table S3, n = 5
