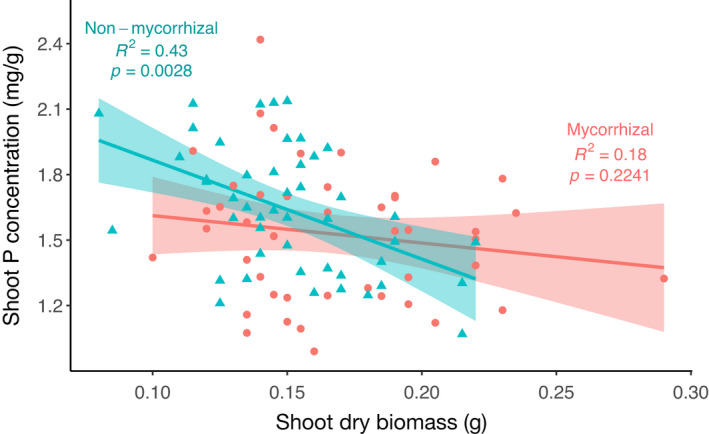
FIGURE 5.

Scatterplot and Spearman rank correlation of wheat (Triticum aestivum L.) shoot dry biomass and shoot phosphorus concentration, with mycorrhizal‐inoculated and mock‐inoculated plotted separately in pink and blue, respectively. Single representative replicates from 50 lines of Avalon × Cadenza DH mapping population are represented, n = 50
