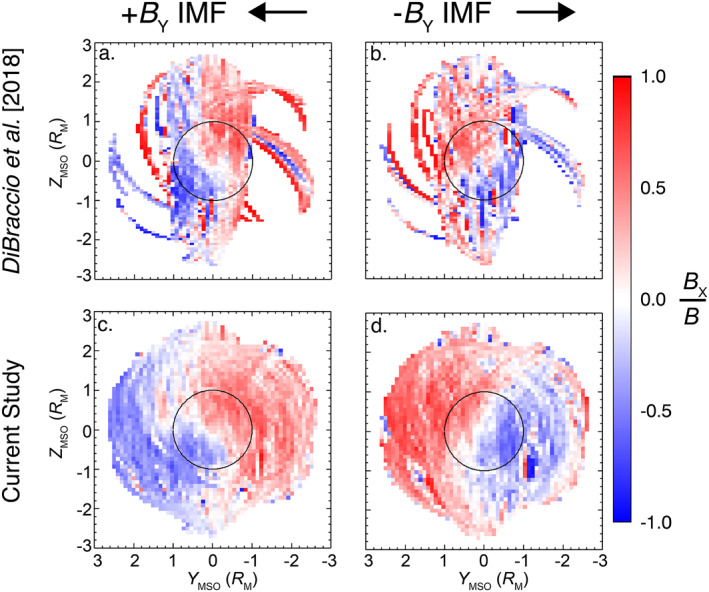
Figure 1.

Magnetic maps of the normalized, average B X component in the Martian magnetotail, separated +B Y IMF (left column) and −B Y IMF (right column) cases. The maps are projections in the Y MSO−Z MSO plane, as viewed from the magnetotail looking towards Mars. Red sectors, +B X/B, represent the sunward tail lobes, while blue sectors, −B X/B, represent the antisunward tail lobes. The black circle represents Mars. (a) and (b) show the original results and coverage from DiBraccio et al. (2018), while (c) and (d) display the updated maps from this present study.
