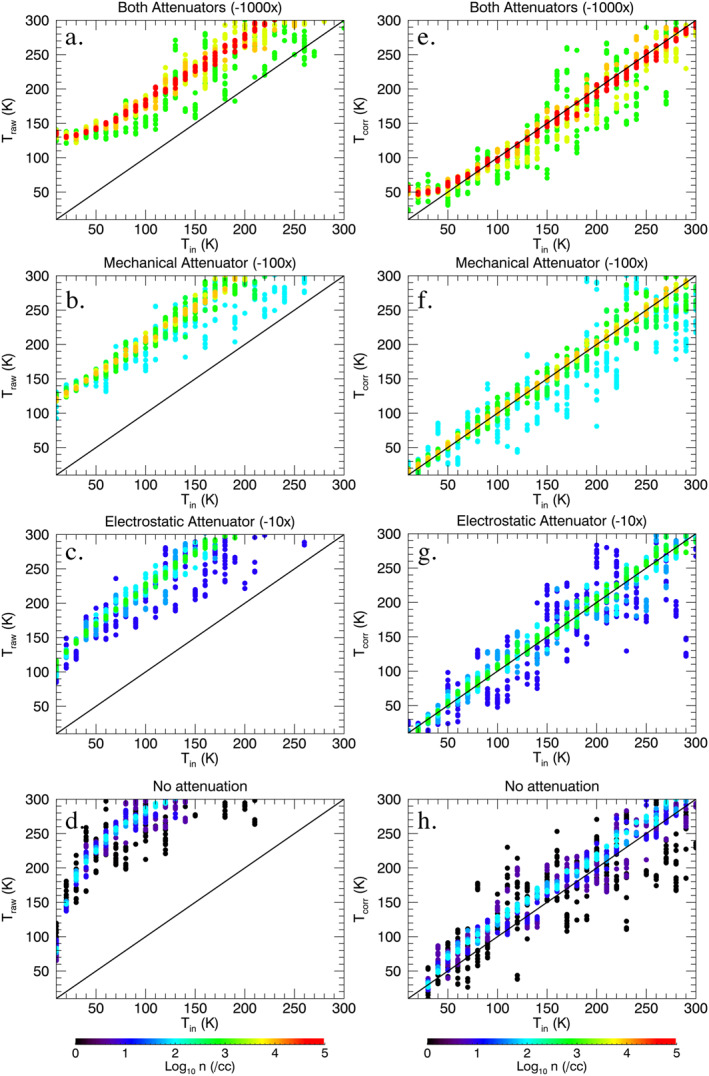
Figure 3.

energy beamwidth temperatures, (a–d) raw and (e–h) corrected for analyzer response, as a function of the temperature Tin of a simulated Maxwellian distribution measured with a simulated STATIC. Color indicates the density of the simulated distribution function. Each row of figures represents a different attenuator state; the number in parentheses indicates the factor by which the ram flux is reduced. The effects of ion suppression and scattering are not included in the simulation. Ion suppression does not affect the temperature measurement; Tscatter is zero during the passes analyzed in this work.
