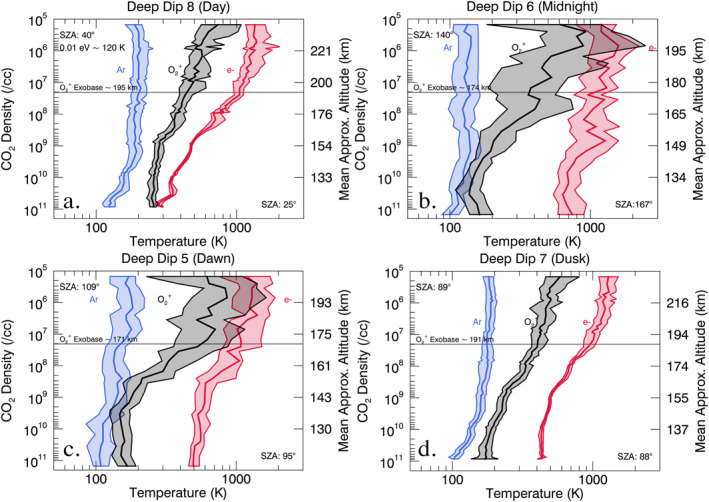
Figure 7.

Median temperature profiles as a function of CO2 density for , Ar, and electrons collected during (a) Deep Dip (DD) 8 at 14:00 local time, (b) DD 6 at 01:00, (c) DD 5 at 05:00, and (d) DD 7 at 20:00. temperatures from STATIC are shown in black, neutral Ar temperatures measured by Mars Atmosphere and Volatile EvolutioN (MAVEN) NGIMS are shown in blue, and electron temperatures from MAVEN LPW are shown in red. Shaded regions represent upper and lower quartiles. Solar zenith angles at the top and bottom of the profiles, which vary by 16° at most, are indicated on the plots. Exobase altitudes indicate where the ion scale height exceeds the mean free path between ion‐neutral collisions.
