FIGURE 2.

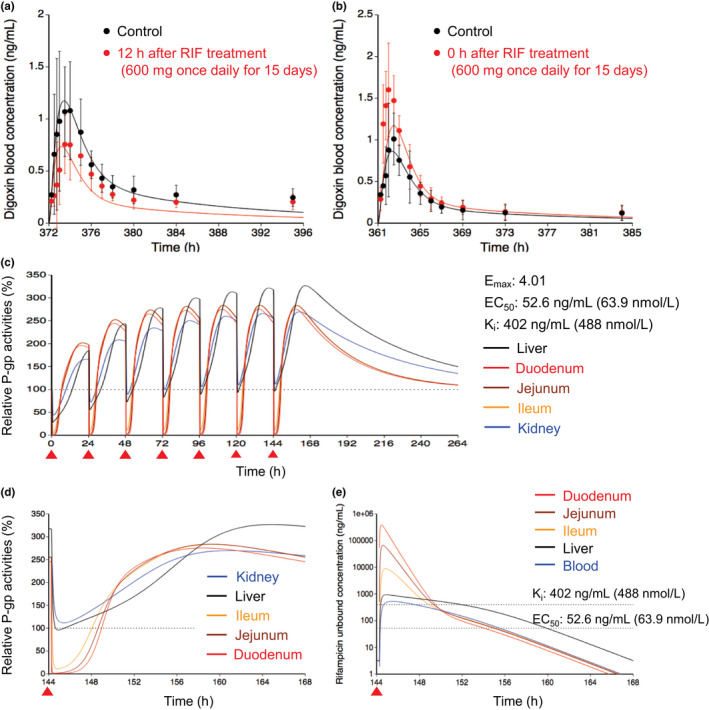
Optimized and observed blood concentration–time profiles of digoxin before and after repeated oral dosing of RIF and relative P‐gp activities in the intestine, liver, and kidney during RIF treatment. (a, b) Blood concentration–time profiles of digoxin after a single oral dose of 0.5 mg digoxin before (black) and after (red) repeated oral dosing of 600 mg RIF once daily for 15 days. 8 The predicted digoxin profiles were shown with the hepatic β value of 0.5 because no major differences were observed with three β values of 0.2, 0.5, and 0.8. Solid lines and closed circles represent optimized and observed blood profiles of digoxin, respectively. Observed blood concentrations were shown as mean ± SD. (c, d) Predicted time profiles of relative P‐gp activities in the first liver (black) of the five‐liver model, duodenum (red), jejunum (brown), ileum (orange), and kidney (blue) during repeated oral dosing of 600 mg RIF. Black dashed horizontal line represents unity. The E max, EC50, and K i values of RIF for P‐gp are indicated at the right side. The degradation rate constant value for P‐gp was set to be 0.0158/h in the liver and kidney or 0.0288/h in the duodenum, jejunum, and ileum. The red closed triangles represent the timing of RIF dosing. The time window from 144 h to 168 h after the last dose of RIF was expanded and shown in Figure 2d. (e) Unbound concentration‐time profiles of RIF in the first liver (black), duodenum (red), jejunum (brown), ileum (orange), and blood (blue) under the same condition as Figure 2d. Black dashed horizontal lines represent K i and EC50 values of RIF for P‐gp. EC50, concentration for the half maximum induction effect; E max, maximum induction effect; K i , inhibition constant; P‐gp, P‐glycoprotein; RIF, rifampicin
