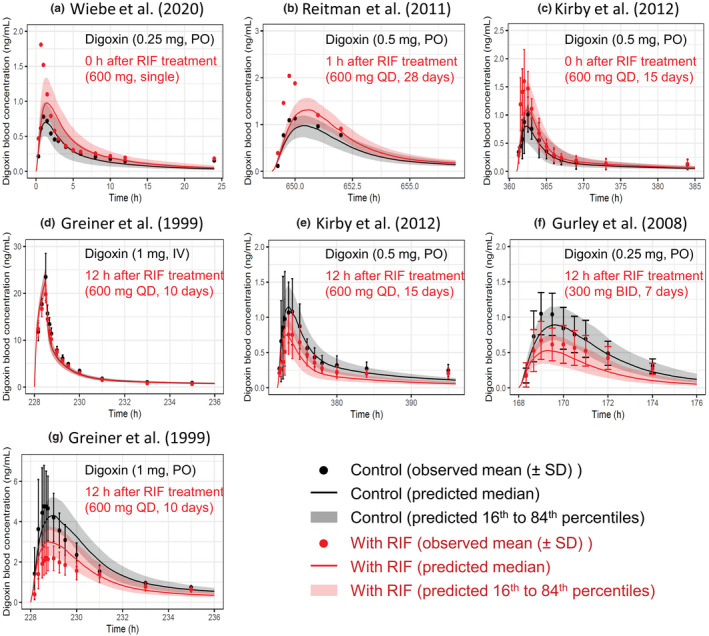
FIGURE 3.

Predicted and observed blood concentration–time profiles of digoxin with various dosing regimens of RIF. Solid lines and closed circles represent predicted and observed blood concentration–time profiles of digoxin before (black) and after (red) RIF treatment. The shaded areas illustrate the respective 68% prediction intervals. The predicted digoxin profiles were shown with the hepatic β value of 0.5 because no major differences was observed with three β values of 0.2, 0.5, and 0.8. For drug–drug interaction predictions, P‐glycoprotein induction and inhibition effects of RIF in the intestine, liver, and kidney were incorporated. Detailed dosing regimens of digoxin and RIF are indicated on each figure. (a) Digoxin was orally dosed with a single PO dose of 600 mg RIF. 9 (b, c, e, g) Digoxin was orally dosed simultaneously (c), 1 h (b), or 12 h (e, g) after the last dose of repeated oral dosing of 600 mg RIF once daily. 6 , 8 , 35 (d) Digoxin was intravenously dosed 12 h after the last dose of repeated oral dosing of 600 mg RIF once daily. 6 (f) Digoxin was orally dosed 12 h after the last dose of repeated oral dosing of 300 mg RIF twice daily. 36 BID, twice daily; IV, intravenous infusion; PO, oral; QD, once daily; RIF, rifampicin
