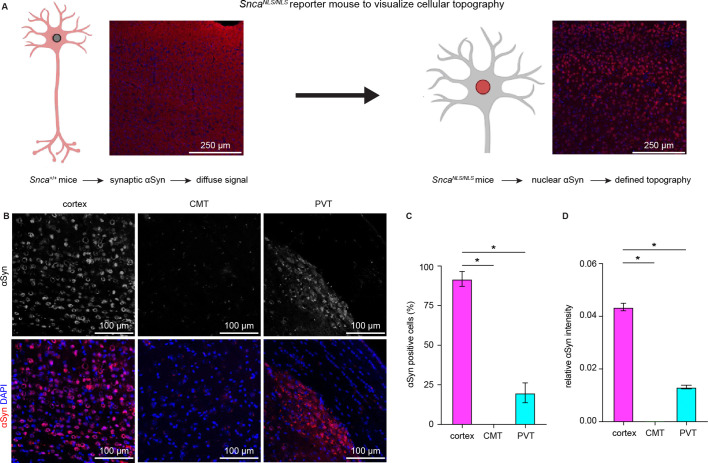
Figure 2. Cerebral cortical neurons express higher levels of endogenous α-synuclein (αSyn) than thalamic neurons.
(A) Schematic of approach to determine cellular topography of αSyn in the SncaNLS/NLS reporter mouse line. (B) Representative photomicrographs in the different highlighted brain regions for either αSyn alone (top panels) or co-stained with DAPI as a nuclear marker. (C–D) Quantification of the proportion of αSyn-positive nuclei (C, % αSyn positive cells, cortex=91.9 ± 4.7%, CMT=0 ± 0%; PVT=19.9 ± 6.3%, n=3 mice) or average relative intensity of αSyn in the different regions (cerebral cortex=0.04 ± 0.001, n=742 cells/3 mice; CMT=0 ± 0, n=364 cells/3 mice; PVT=0.01 ± 0.0007, n=734 cells/3 mice). * p<0.05, one-way ANOVA followed by Sidak’s multiple comparison tests. Abbreviations: CMT, centromedial thalamus; PVT, periventricular thalamus.

