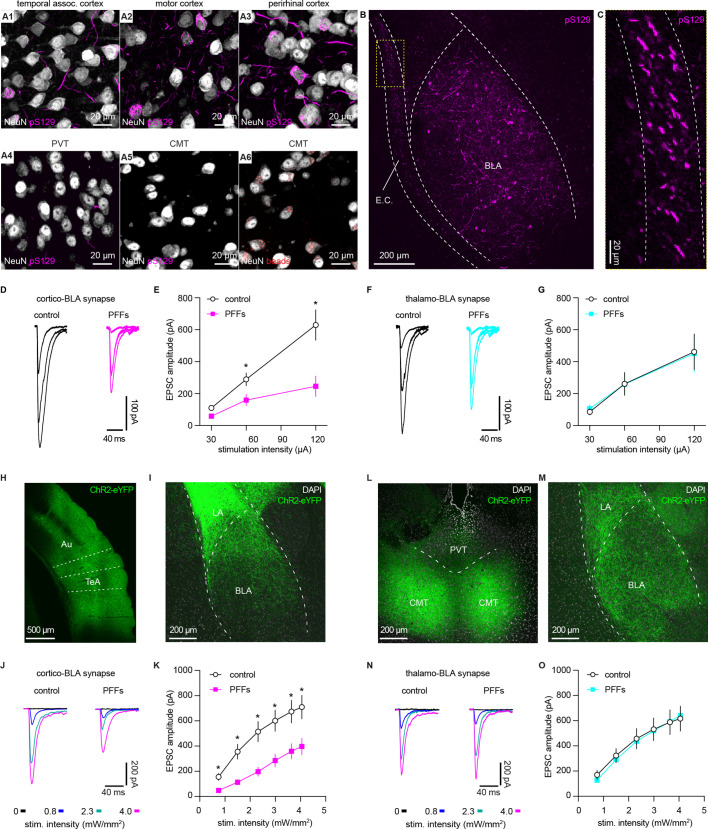
Figure 3. α-synuclein (αSyn) aggregates preferentially disrupt vesicular glutamate transporter 1 (vGluT1+) cortico-BLA transmission.
(A) Representative images showing the presence of αSyn aggregates in the cortical regions (A1–A3), but largely absent in the midline thalamus (A4–A5). A6, representative images showing retrobeads labeled neurons in the centromedial thalamus. (B–C) Representative images showing pS129+ αSyn pathology in the basolateral amygdala (BLA) (B) and the external capsule (C). (D–E) Representative traces of excitatory postsynaptic currents (EPSCs) evoked by electrical stimulation of the external capsule (D) and summarized results (E) showing a reduced cortico-BLA transmission in slices from preformed fibrils (PFFs)- versus PBS-injected mice. n=17 neurons/4 mice for each group. (F–G) Representative traces of EPSCs evoked by electrical stimulation of the internal capsule (F) and summarized results (G) showing unaltered thalamo-BLA transmission in slices from PFFs- versus PBS-injected wildtype mice. n=17 cells/5 mice for controls, and 13 cells/4 PFF-injected mice. (H–I) Representative images showing viral infection site in the temporal association cortex (TeA) and nearby regions (H), and the axon terminal field in the BLA (I). (J–K) Representative traces of optogenetically-evoked EPSCs (J) and summarized results (K) showing a reduced amplitude of cortico-BLA EPSCs in slices from PFFs- versus PBS-injected mice. n=35–37 neurons/4 mice per group. (L–M) Representative images showing viral infection site in the midline thalamus (L), and the axon terminal field in the BLA (M). (N–O) Representative traces of optogenetically-evoked EPSCs (N) and summarized results (O) showing unaltered thalamo-BLA transmission in slices from PFFs- versus PBS-injected mice. n=28 neurons/4 mice per group. *, p<0.05, MWU followed by Bonferroni-Dunn correction for multiple comparisons. Abbreviations: CMT, centromedial thalamus; PVT, periventricular thalamus.


