. 2022 Jul 15;11:e64329. doi: 10.7554/eLife.64329

Figure 1. Study design and body weight data summaries.

(A) Outline of study design. (B) Median (interquartile range) body weight in grams and (C) median (interquartile range) growth rate in grams per day for five dietary treatments from 60 to 660 days of age. Vertical gray dotted line denotes the onset of dietary intervention at 180 days of age.

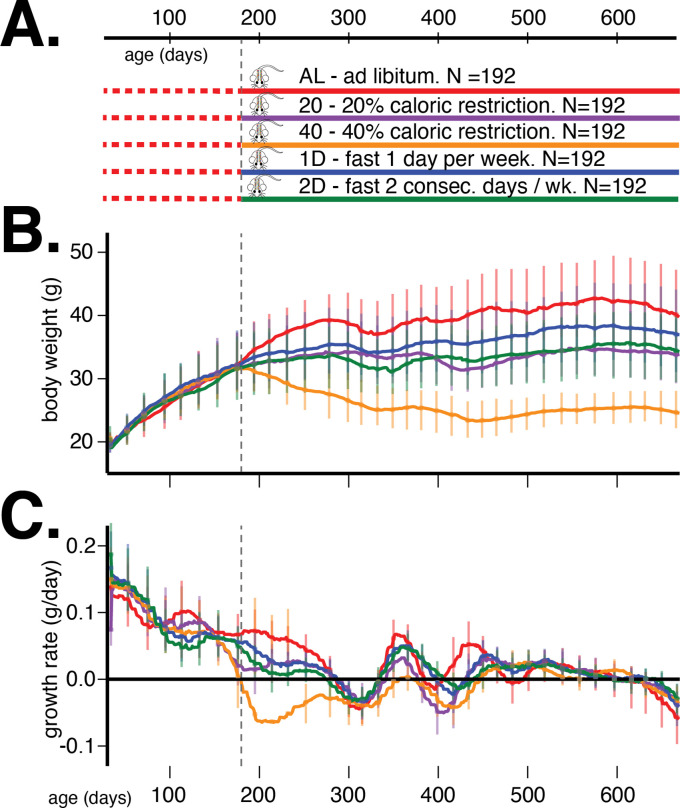
Figure 1.

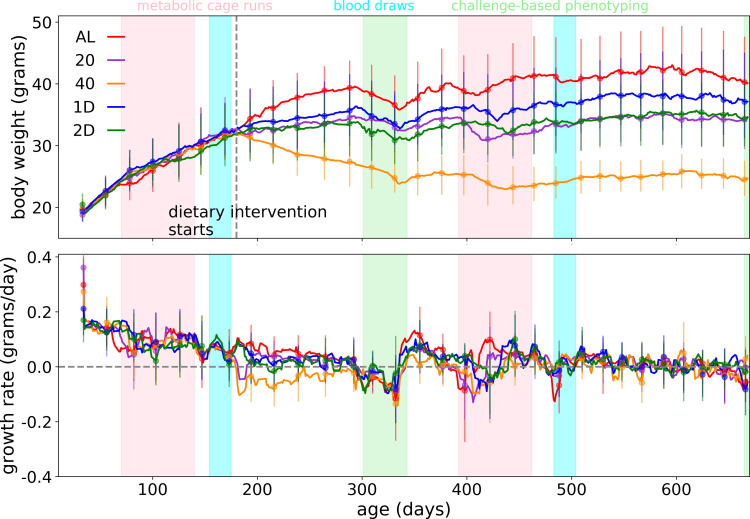
Figure 1—figure supplement 1. Raw phenotype measurements.

Figure 1—figure supplement 1.

Body weight and growth rate trends as a function of age. Mice in this study also underwent an array of phenotyping procedures; the age range for metabolic cage phenotyping is highlighted in pink, the age range for blood draws is highlighted in blue, and the age range for a battery of challenge-based phenotyping procedures is highlighted in green.