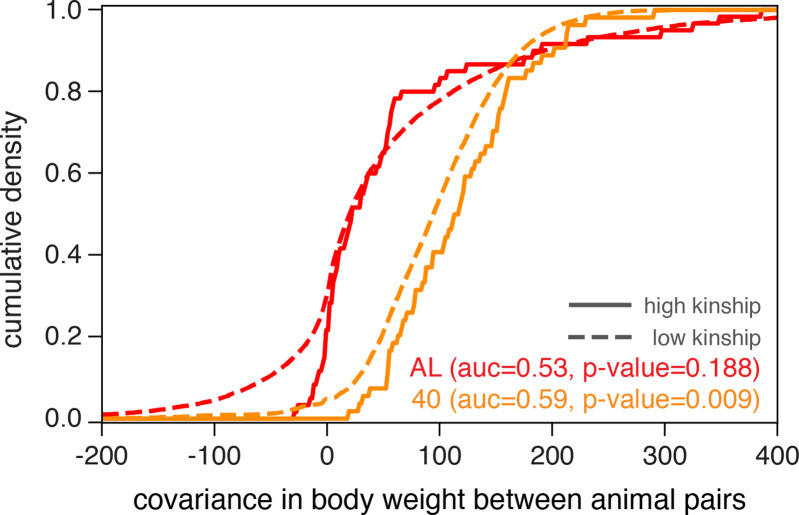
Figure 2. Illustrating diet-dependent association between genetic and phenotypic similarities.
Phenotypic divergence between animal pairs is quantified by the covariance in body weight at 500 days of age. We plot the cumulative density of body weight covariance for all pairs of animals in the ad libitum (AL) and 40% calorie restriction (CR) dietary treatments, partitioned into high-kinship (>0.2) or low-kinship groups. We test for separability between the high- and low-kinship distributions using the Mann–Whitney U test, and report p-values from this test. The reported area under the curve (AUC) is a standard transformation of the Mann-Whitney U test statistic.

