. 2022 Jul 15;11:e64329. doi: 10.7554/eLife.64329

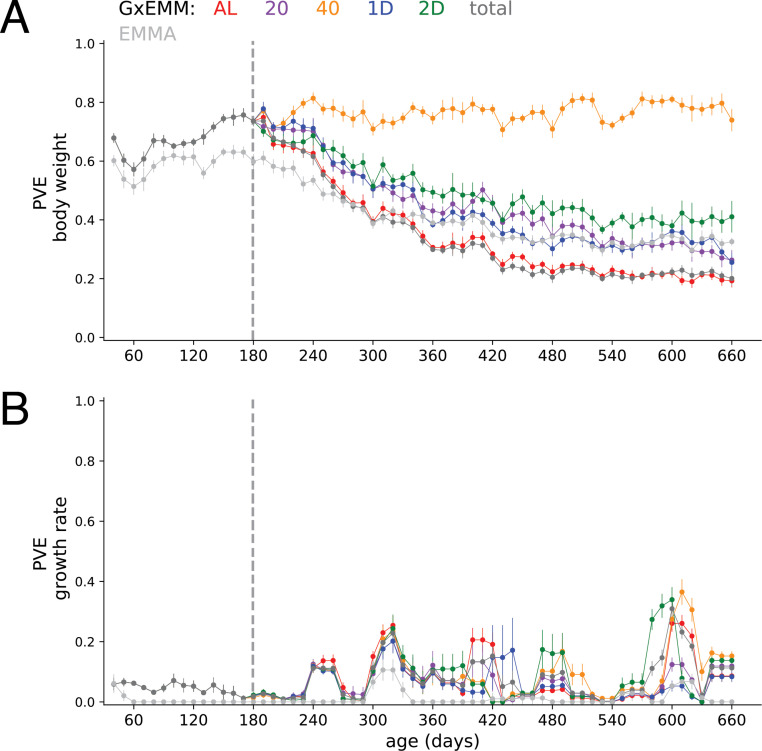
Figure 4. Proportion of phenotypic variance explained by genetics.

(A) Body weight proportion of phenotypic variance explained by genetics (PVE) (± SE) for 30–660 days of age. Total PVE estimates are derived from the EMMA (light gray) and gene–environment mixed mode (G×EMM) (dark gray) models. Diet-dependent PVE values were derived from the G×EMM model. Dotted vertical line at 180 days depicts the time at which all animals were switched to their assigned diets. (B) Growth rate PVE; details the same as (A).

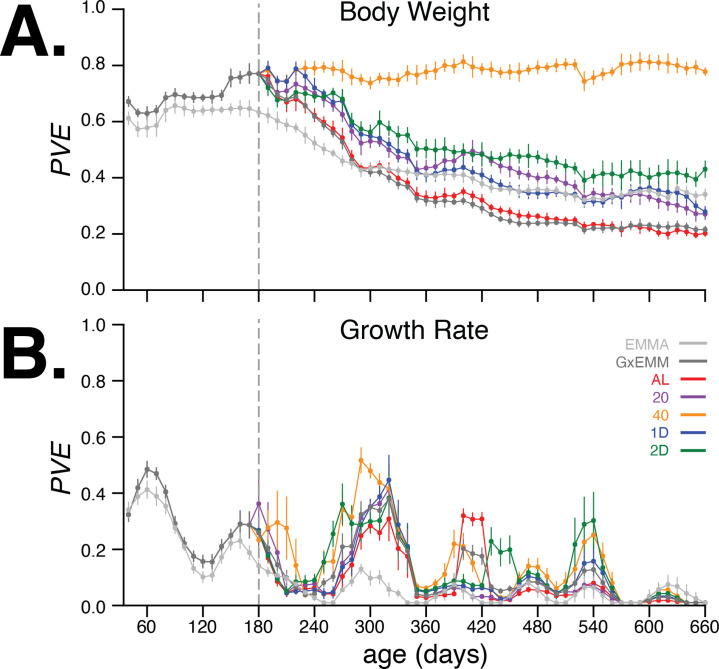
Figure 4.

Figure 4—figure supplement 1. Proportion of phenotypic variance explained by genetics (PVE) using raw measurements.

Figure 4—figure supplement 1.

PVE (±SE) of (A) Body weight and (B) growth rate, estimated using raw body weight measurements.
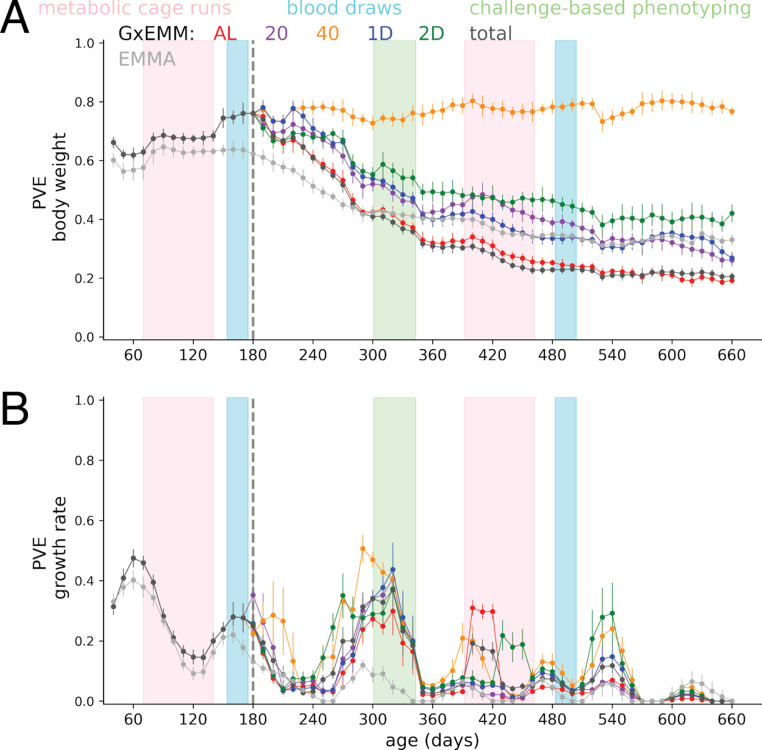
Figure 4—figure supplement 2. Proportion of phenotypic variance explained by genetics (PVE) overlayed with phenotyping.

Figure 4—figure supplement 2.

PVE (± SE) of (A) Body weight and (B) growth rate, overlayed with the timing of bouts of phenotyping.
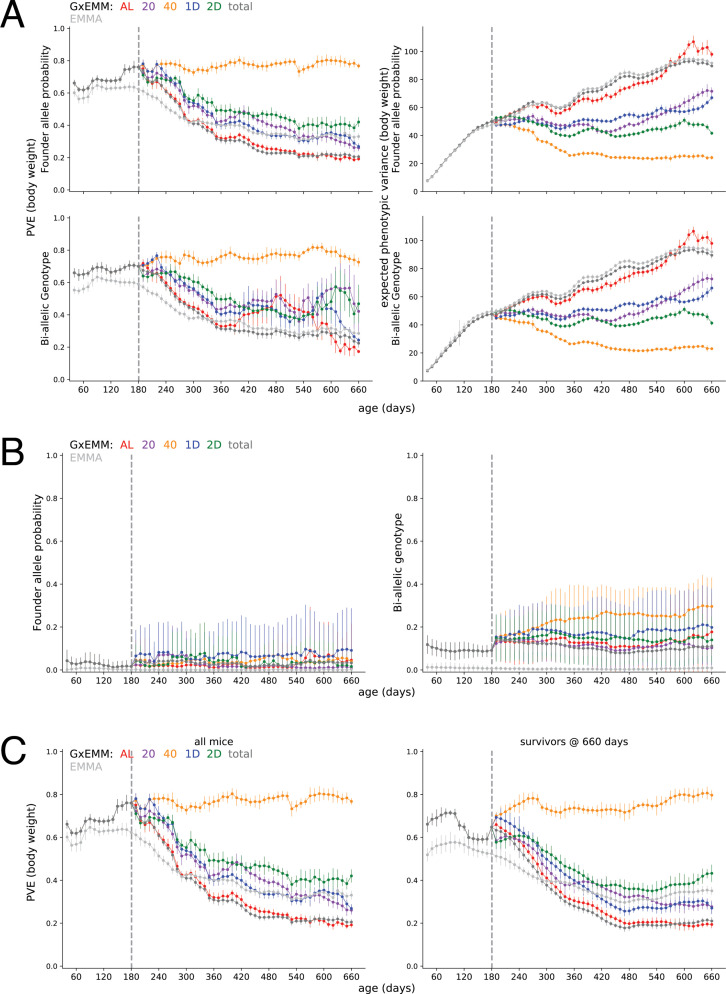
Figure 4—figure supplement 3. Sensitivity of proportion of phenotypic variance explained by genetics (PVE).

Figure 4—figure supplement 3.

(A) PVE (± SE) (left column) and expected phenotypic variance (±SE) (right column) estimated using kinship calculated from founder-of-origin allele probabilities (top row) and biallelic genotypes (bottom row). (B) PVE (±SE) estimated using kinship calculated from founder-of-origin allele probabilities (left column) and biallelic genotypes (right column), after randomly permuting body weight trajectories across mice, within each dietary intervention. (C) PVE (±SE) estimated using all mice in the study (left column) and mice that survived to 660 days of age (right column).
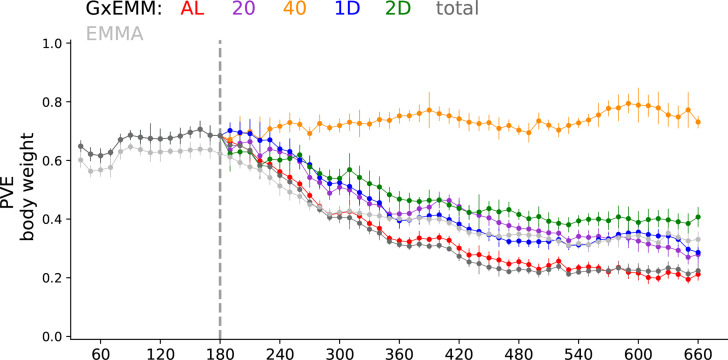
Figure 4—figure supplement 4. Proportion of phenotypic variance explained by genetics (PVE) with no constraints on variance components.

Figure 4—figure supplement 4.

PVE (±SE) of body weight was estimated without imposing any non-negativity constraints on the variance components in the gene–environment mixed mode (G×EMM) model.
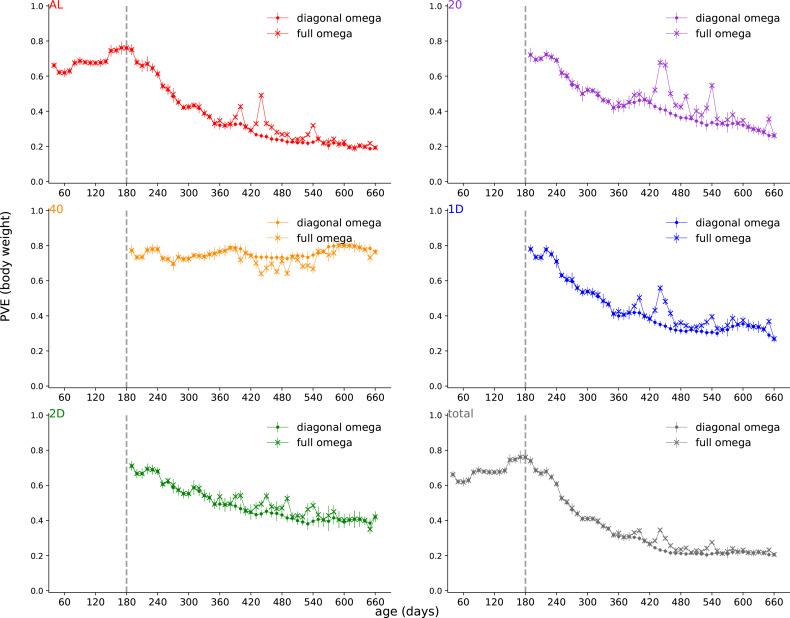
Figure 4—figure supplement 5. Proportion of phenotypic variance explained by genetics (PVE) comparing full and diagonal Ω.

Figure 4—figure supplement 5.

PVE (± SE) of body weight was estimated with and without a diagonal constraint on Ω.
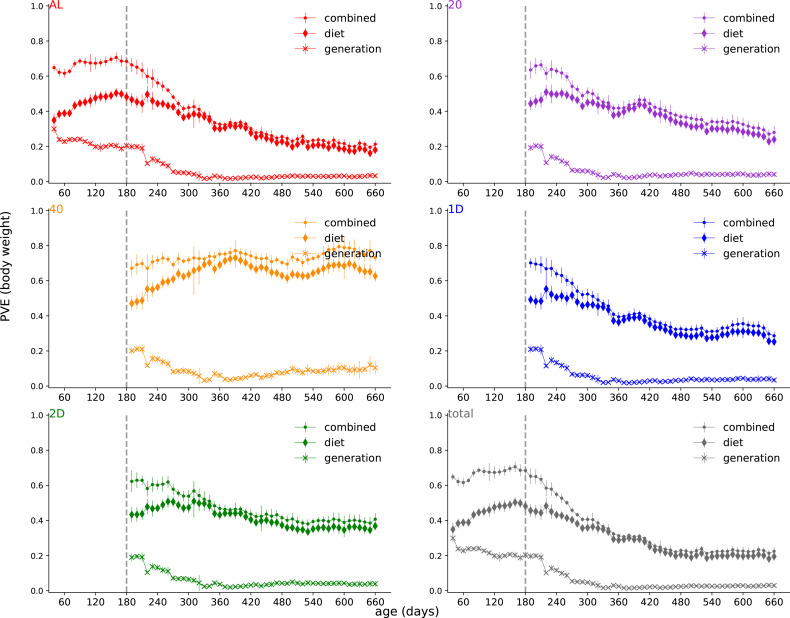
Figure 4—figure supplement 6. Proportion of phenotypic variance explained by genetics (PVE) decomposition.

Figure 4—figure supplement 6.

Decomposing the total and diet-dependent PVE into contributions from diet terms (diamonds) and contributions from generation terms (x-markers).