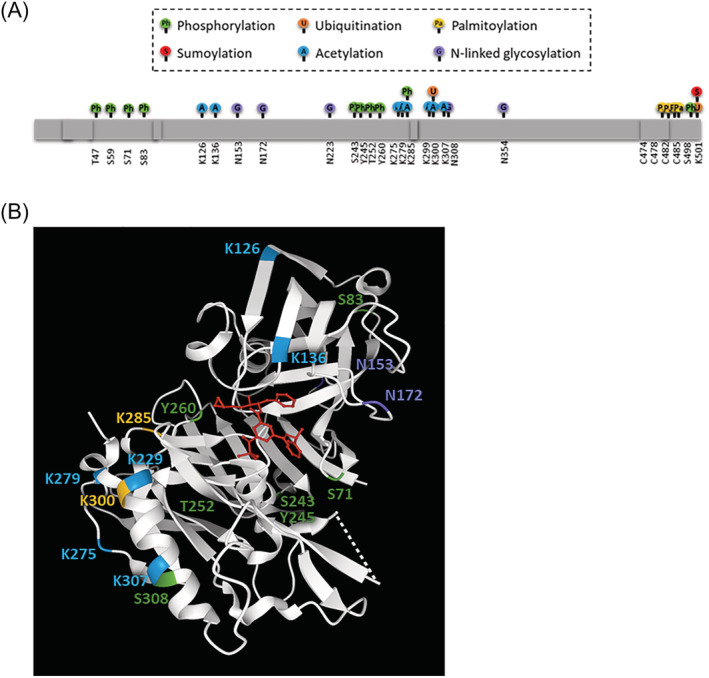
FIGURE 3.

Post‐translational modifications on BACE1. (A) Diagram showing all post‐translational modifications reported in the literature, and predicted phosphorylation sites from Phosphosite (https://www.phosphosite.org/). This includes phosphorylation (green) at T47, S59, S71, S83, S243, S245, S252, S260, S308, and S498. SUMOylation (red) at K501. Ubiquitination (orange) at K285, K300 and K501. Acetylation (blue) at K126, K136, K275, K279, K285, K299, K300, and K307. Palmitoylation (yellow) at C478, C482, C485, and C474. N‐linked glycosylation (purple) at N153, N172, D223, and D354. (B) BACE1 crystal structure with inhibitor C3 (red) made using structure 3TPR on RSCB Protein DataBank (https://www.rcsb.org/). Not all modifications are shown as 62 residues are missing, including N‐ and C‐terminal regions. Phosphorylation (green), ubiquitination (orange), acetylation (blue) and N‐linked glycosylation sites (purple) are labeled on the BACE1 crystal structure
