Figure 5.

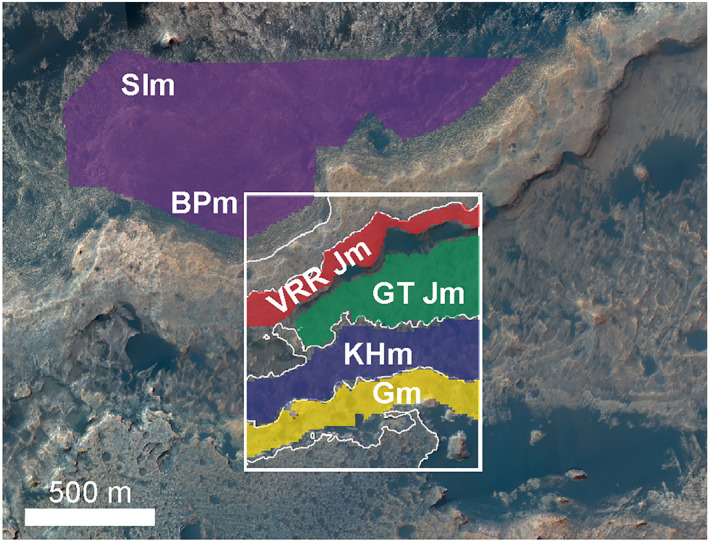
Areas over which the thermal inertia values reported in Table 2 were averaged. The center coordinate (lat, lon) of the area shown is −4.7257, 137.3852. North is up.

Areas over which the thermal inertia values reported in Table 2 were averaged. The center coordinate (lat, lon) of the area shown is −4.7257, 137.3852. North is up.