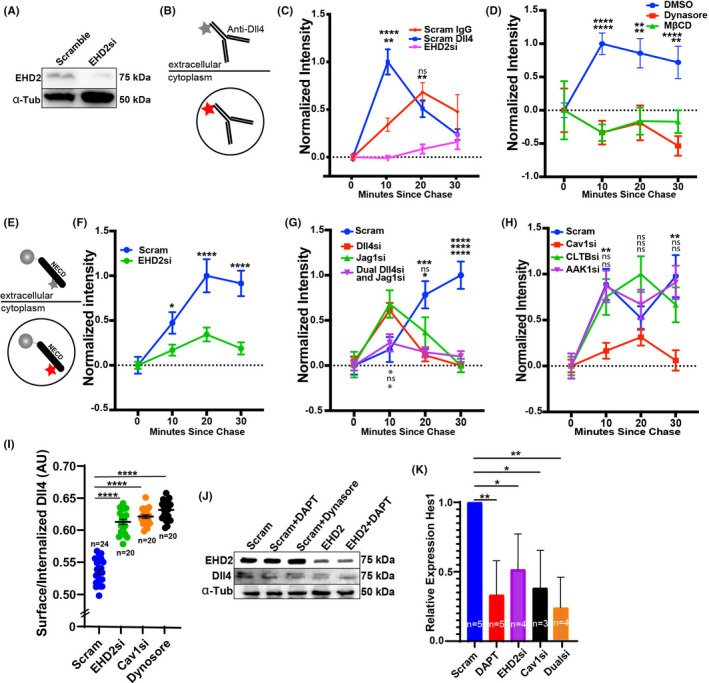
FIGURE 4.

Loss of EHD2 blunts Dll4 endocytosis. (A) Western blot of EHD2 after siRNA (si) treatment in comparison to scramble (Scram) control in Human vein endothelial cells. (B) Schematic of pHrodo‐labeled delta‐like ligand 4 (Dll4) antibody. PHrodo gains fluorescent intensity with increasing endosomal pH, thus used as a metric of endocytosis. (C) Relative internalization of pHrodo‐Dll4 pulse‐chase over time between indicated siRNA groups. IgG was used as a non‐specific internalization control. A minimum of 50 cells were used per group. Order of comparisons (top to bottom): Scram si vs. EHD2 si; Scram IgG vs. pHrodo‐Dll4 with EHD2 si. (D) Relative internalization of pHrodo‐Dll4 pulse‐chase over time between indicated groups. A minimum of 50 cells were used per group. Order of comparisons (top to bottom): DMSO vs. Dynosore; DMSO vs. MβCD. (E) Schematic of recombinant Notch intracellular domain (NECD) functionalized to microbead and labeled with pHrodo. (F) Relative internalization of functionalized NECD pulse‐chase over time between indicated siRNA groups. A minimum of 50 cells were used per group. Comparisons: Scram si vs. EHD2 si treated cells. (G) Relative internalization of functionalized NECD pulse‐chase over time between indicated siRNA groups. A minimum of 50 cells were used per group. Order of comparisons (top to bottom): Scram si vs. Dll4 si; Scram si vs. Jagged1 (Jag1) si; Scram si vs. Dll4 and Jag1 si treated cells. (H) Relative internalization of functionalized NECD pulse‐chase over time between indicated siRNA groups. A minimum of 50 cells were used per group. Order of comparisons (top to bottom): Scram si vs. caveolin1 (Cav1) si; Scram si vs. clathrin light chain B (CLTB) si; Scram si vs. AP2 Associated Kinase 1 (AAK1) si treated cells. (I) Antibody feeding assay comparing internalized to surface‐bound ratio Dll4 between indicated groups. N, number of cells. (J) Western blot of Dll4 levels across indicated treatment groups. (K) Relative expression of Hes1 compared to GAPDH control in indicated si treatment groups. N, number of replicates. *p < .05, **p < .01, ***p < .001, ****p < .0001. ns, non‐significant. Error bars are SEM. All experiments were done at minimum in triplicate
