FIGURE 6.

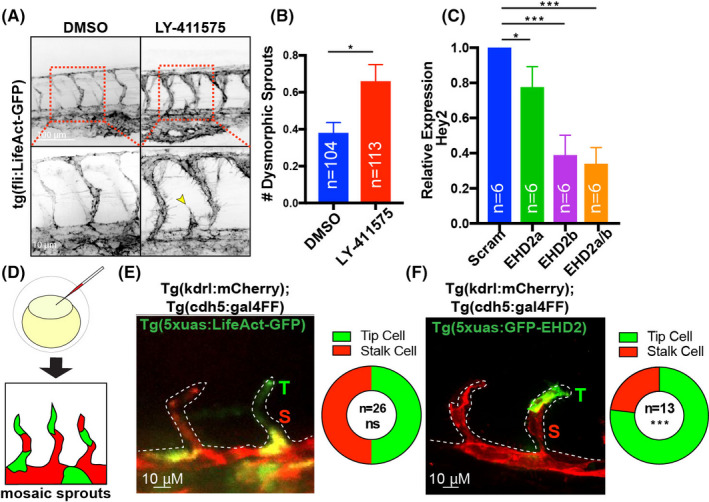
EHD2 knockout phenocopies Notch loss of function. (A) Intersomic vessels (ISVs) of fish treated with either DMSO or 2 µM LY‐411575 on tg(fli:LifeAct)+/+ background at 48 h post fertilization (hpf). Yellow arrowheads point to dysmorphic sprouts. (B) Number of dysmorphic ISVs between indicated groups. (C) Relative expression of Hey2 transcript in 48hpf Crispant groups normalized to GAPDH. 10–20 fish were pooled per repeat. N, number of repeats. (D) Cartoon of method to produce mosaic expression in zebrafish blood vessels. (E,F) Representative images of ISVs expressing mCherry (tg(kdrl:mCherry), LifeAct‐GFP or GFP‐EHD2 at 24 hpf. Quantification of the proportion of expressing endothelial cells in either the tip (T, green) or stalk (S, red) cell positions in the vascular sprouts shown to the left. N, number of fish. Significance *p < .05, ***p < .001. ns, non‐significant. Error bars are SEM. All experiments were done at minimum in triplicate
