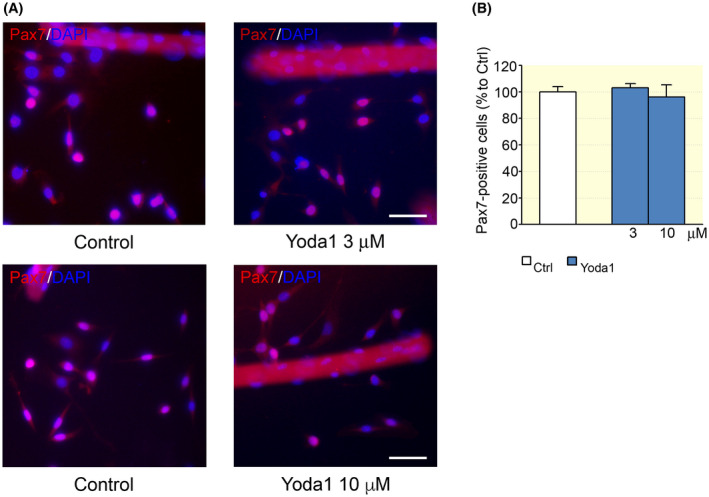
FIGURE 2.

Effect of Yoda1 on Pax7‐positive cell numbers. A, Pax7‐positive satellite cells (SCs) after 48 h from the dissociation, in control conditions and in the presence of Yoda1 (3 and 10 μM). Scale bars: 50 μm. B, The cell treatment with 3 or 10 μM did not affect the percentage of Pax7‐positive cells (control: n = 131; 3 μM: n = 137; 10 μM: n = 29 optical fields; P > .05, ANOVA, Dunnett's post hoc test). Experimental replicates n = 4; data from five independent experiments
