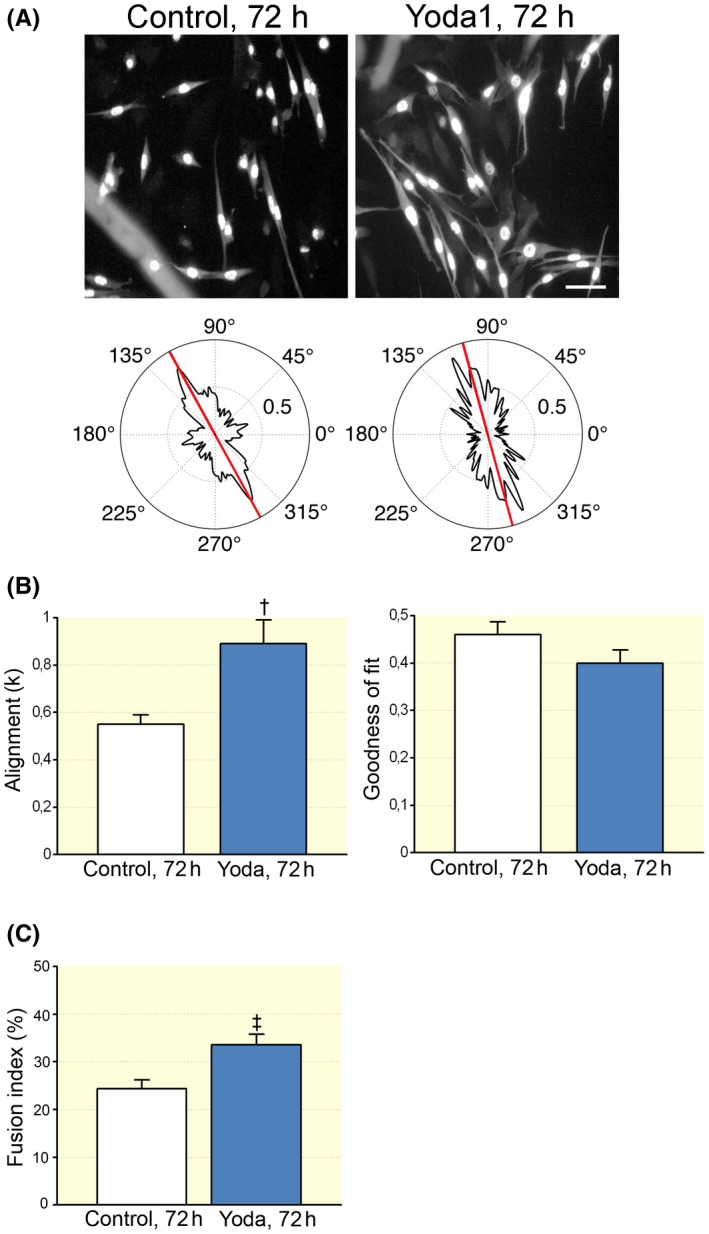
FIGURE 4.

Yoda1 affected myocyte orientation. A, Representative 8‐bit greyscale images of MyoG‐positive cells cultured in differentiation medium for 72 h and, below, the corresponding analysis of the mean cell orientation using the FiberFit software. Scale bar: 50 μm. B, On the left, the dispersion parameter k, which quantifies the degree of cell alignment (for further details, see Section 4) in control condition (n = 69 cells) and in cells treated with Yoda1 (3 μM) (n = 61 cells; † P = .0089, t test). On the right, the goodness of fit R 2 (P = .14, Mann–Whitney test). Control and treated cells were from different culture dishes. Experimental replicates n = 3; data from two independent experiments. C, The presence of Yoda1 (3 μM) increased the number of multinucleated desmin‐positive cells (control: 24.38% ± 1.85%, n = 42 optical fields; Yoda1: 33.53% ± 2.28% , n = 53 optical fields; ‡ P = .0034, t test). Experimental replicates n = 3; data from four independent experiments
