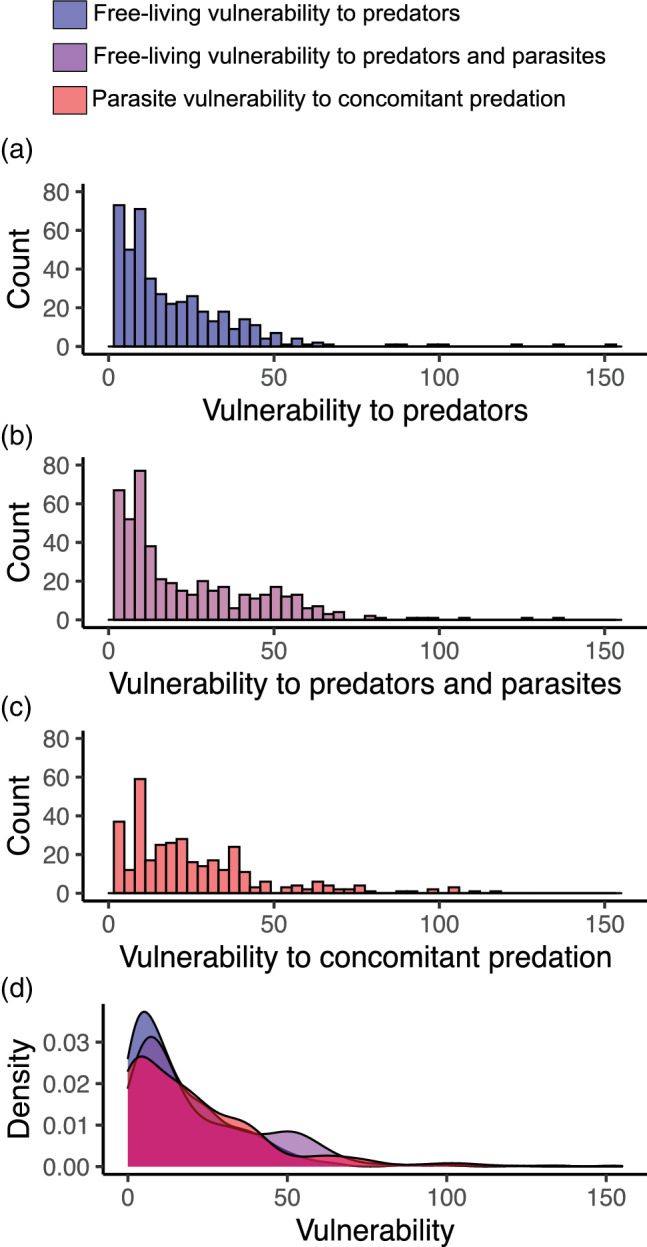
FIGURE 5.

Vulnerability of free‐living species and parasites to enemies. Panels (a–c) are histograms: (a) free‐living vulnerability to predators, (b) free‐living vulnerability to both predators and parasites, (c) parasite vulnerability to concomitant predation. (d) The same information as density plots, overlayed for easier comparison. Terms are defined in Table 1
